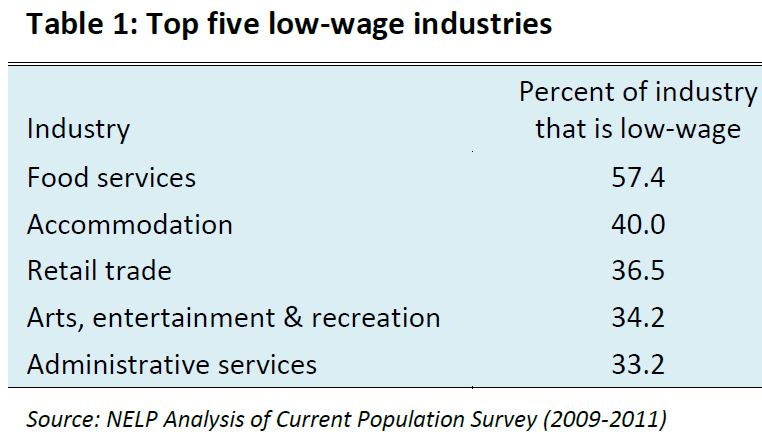
The National Employment Law Project (NELP) recently released a report about low-wage workers — those making less than $10 an hour. In 2011, 26% of private-sector jobs in the U.S. were low-wage jobs. These jobs were highly concentrated in a few industries. Just over half (52.1%) of all low-wage workers were employed in five sectors:
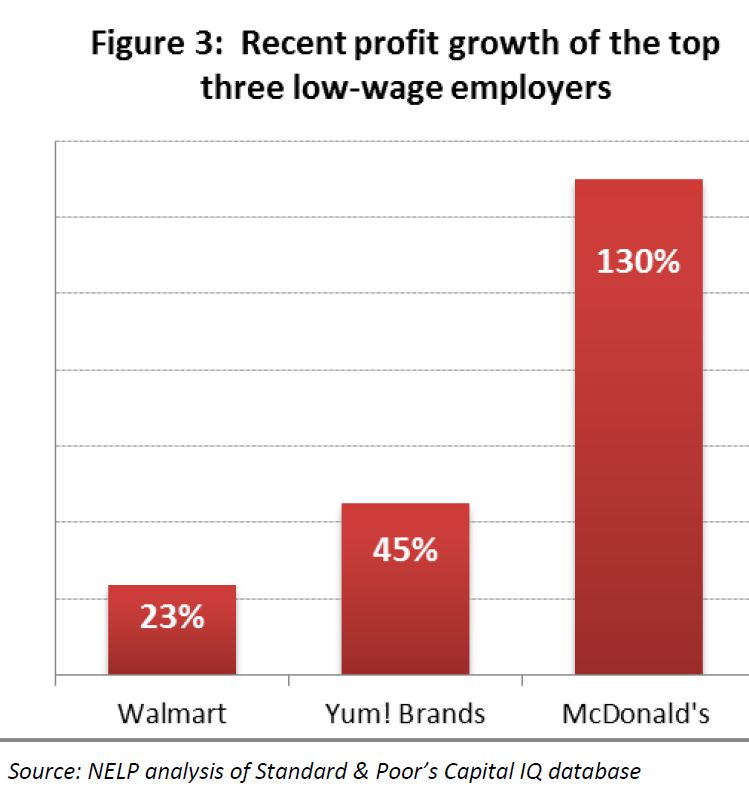
Most low-wage workers are employed by large businesses, those with more than 100 employees. NELP looked at the three largest employers of low-wage workers — Wal-Mart, Yum! Brands, and McDonald’s. All three have seen significant profit growth over the last four years:
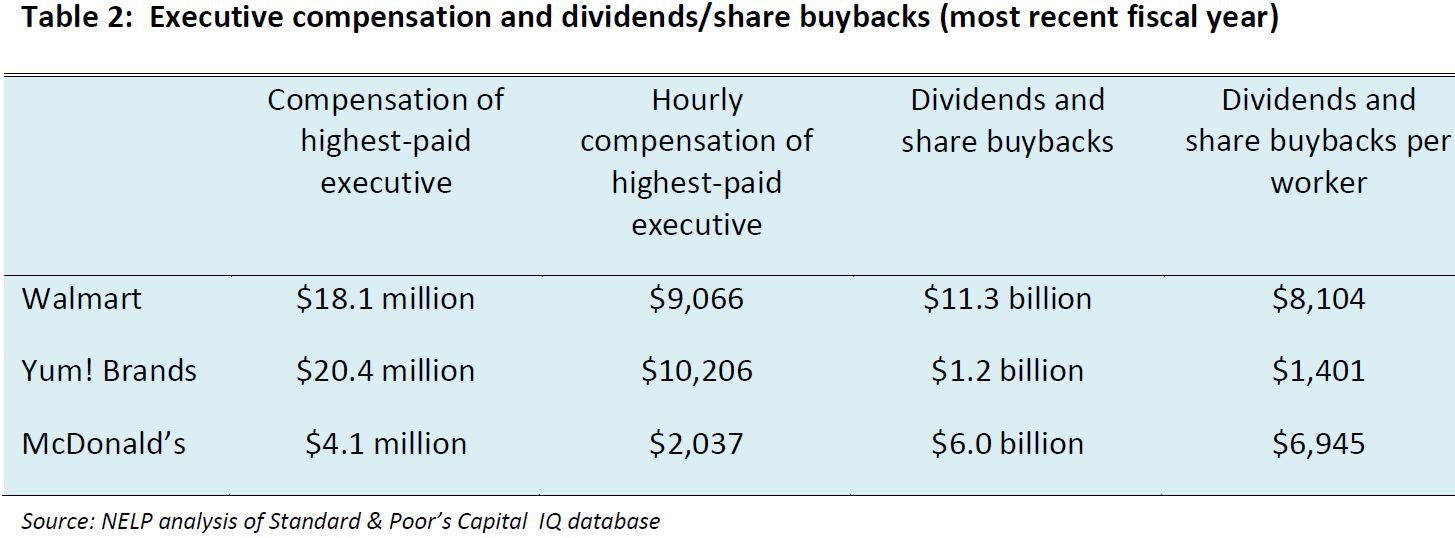
The heads of these corporations are doing quite well, too:
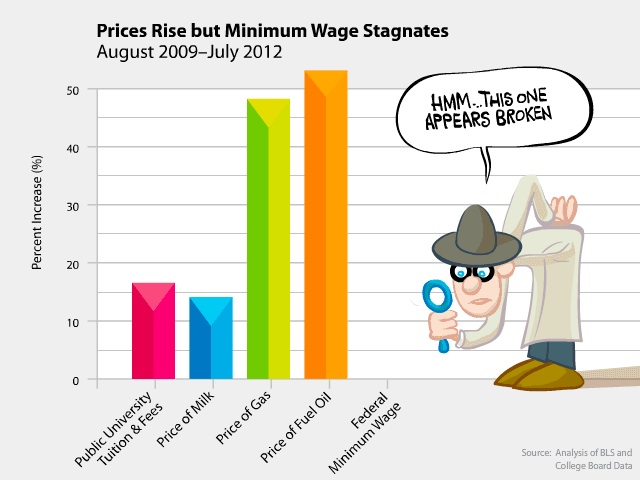
Care 2 posted about the report and included additional details about low-wage workers. The relative worth of the minimum wage continues to decline, since prices for common consumer goods increase while the minimum wage is stuck at $7.25 an hour:
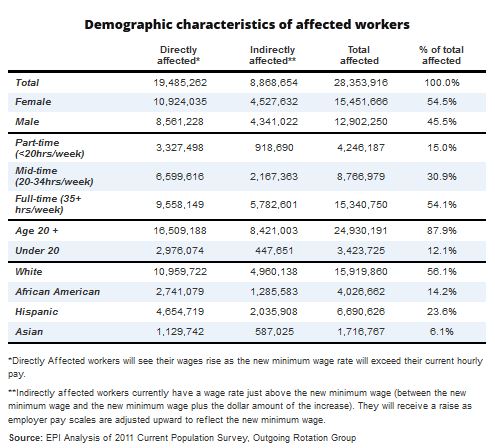
Finally, over at the Economic Policy Institute blog, David Cooper posted a table that provides an overview of the demographics of those who would be affected if Congress passed Senator Tom Harkin’s proposed bill that would raised the minimum wage to $9.80/hour:
Thanks to Dolores R. for the links!