Cross-posted at Reports from the Economic Front.
Presidential candidate Mitt Romney’s low federal tax rate — 14.1% — has called attention to the fact that our tax code favors people who make their money from investments rather than labor. According to the conventional wisdom, this is as it should be. It encourages people, like our job creators, to invest their money, thereby boosting growth and the well-being of all working people. Sounds plausible, but the facts don’t support the policy.
BusinessWeek lays out the background and political context for our current low taxation rates on investment income as follows:
Since 1950 capital gains have generally been taxed at a lower rate than income, to spur investment. The rate under President George W. Bush went from 20 percent to 15 — the lowest ever — and was billed as a way to stimulate the economy. (If nothing’s done by Jan. 1 to change tax and budget provisions already passed by Congress, the rate will snap back to 20 percent, a scenario both parties hope to avoid.) Mitt Romney wants to ditch capital gains tax altogether for people earning less than $250,000. President Barack Obama, in his Affordable Care Act, increased the rate by 3.8 percent for high earners beginning in 2013, and has proposed the so-called Buffett Rule, which would among other things end an accounting interpretation that allows private equity and hedge fund managers (and Romney) to save money by paying tax on their earnings at the capital gains rate. Neither candidate, though, contests the Bush administration’s basic logic: that a lower capital gains rate encourages investment, which creates jobs and helps the economy grow. That doesn’t mean they’re right.
Leonard E. Burman, a tax expert, took on this issue in recent testimony before the House Committee on Ways and Means and the Senate Committee on Finance. A good place to start is with who benefits from lower capital gains taxes.
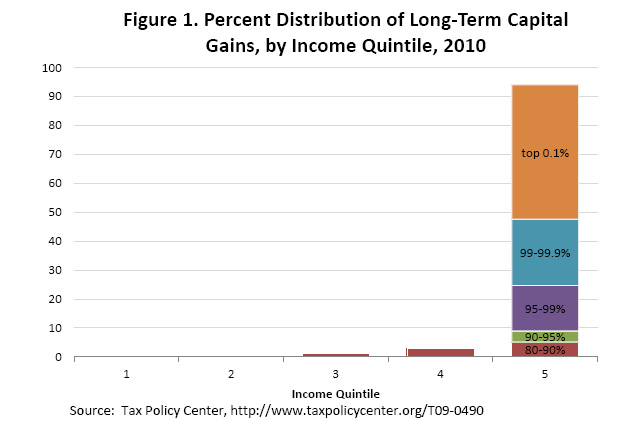
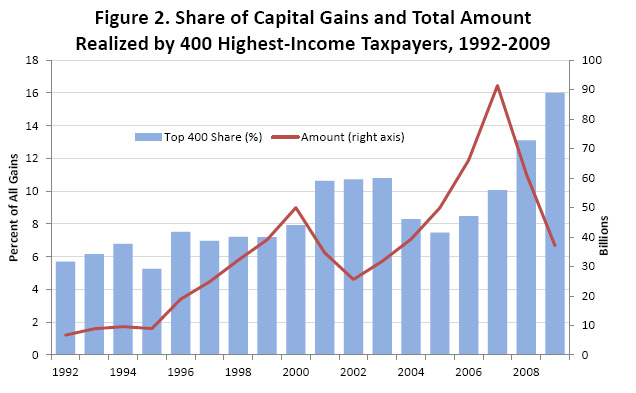
Not surprisingly, as the figure below (which is taken from Burman’s testimony) shows, the benefits are extremely concentrated. As Burman noted:
In 2010, the highest-income 20 percent realized more than 90 percent of long-term capital gains according to the TaxPolicyCenter. The top 1 percent realized almost 70 percent of gains and the richest 1 in 1,000 households accrued about 47 percent. It is hard to think of another form of income that is more concentrated by income.
Moreover, as the next figure shows, the concentration of capital gains has grown over time. Given that the rich fund political campaigns, this certainly helps to explain why both political parties are so determined to keep the rate low.
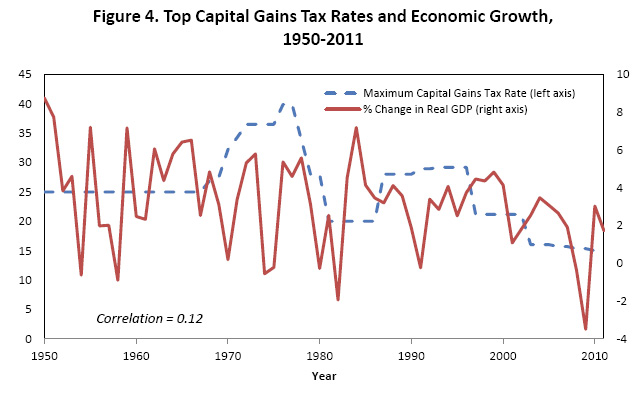
But, to the main question — do lower capital gains taxes actually boost growth? This is what Burman had to say in his testimony:
The heated rhetoric notwithstanding, there is no obvious relationship between tax rates on capital gains and economic growth. Figure 4 [below] shows top tax rates on long-term capital gains and real economic growth (measured as the percentage change in real GDP) from 1950 to 2011. If low capital gains tax rates catalyzed economic growth, we’d expect to see a negative relationship — high gains rates, low growth, and vice versa — but there is no apparent relationship between the two time series. The correlation is 0.12, the opposite sign from what capital gains tax cut advocates would expect, and not statistically different from zero. Although not shown, I’ve tried lags up to five years and using moving averages, but there is never a larger or statistically significant relationship.
Burman notes that he posted this figure on his blog and offered the data to anyone interested, challenging readers to find support for lower rates. “A half dozen or so people, including at least one outspoken critic of taxing capital gains, took me up on the offer, but nobody to my knowledge has been able to tease a meaningful relationship between capital gains tax rates and the GDP out of the data.”
As reported in a previous post, Thomes L. Hungerford, writing for the Congressional Research Service, came to the same conclusion about the lack of any relationship between the capital gains tax and GDP. In fact, he concluded raising the top income and capital gains tax rates would likely reduce income inequality without causing harm to the economy.
So, if we are really concerned with the budget deficit, rather than slashing spending on social programs lets raise the top tax rates. Wonder if this will come up during our presidential debates?
—————————
Martin Hart-Landsberg is a professor of Economics and Director of the Political Economy Program at Lewis and Clark College. You can follow him at Reports from the Economic Front.