
There are six (progressive) tax brackets for income. The tax rate paid by earners is bumped up each time they reach a bracket threshold. The threshholds are determined by type of household. Here’s a handy chart for 2012 from Wikipedia:
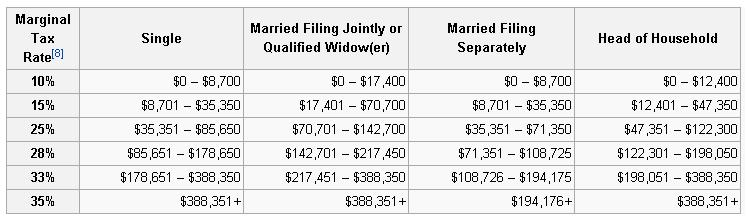
U.S. politicians are now debating how these tax rates should change and they often focus on the “marginal” or “top” tax rate. That’s the one that applies to the highest tax bracket, right now at 35%.
Dylan Matthews at the WonkBlog notes that the squabbling has been mostly over a percentage point or two. Small beans, he asserts. To put this in perspective, he includes this graph of fluctuations in the top tax rates throughout history (click to enlarge):
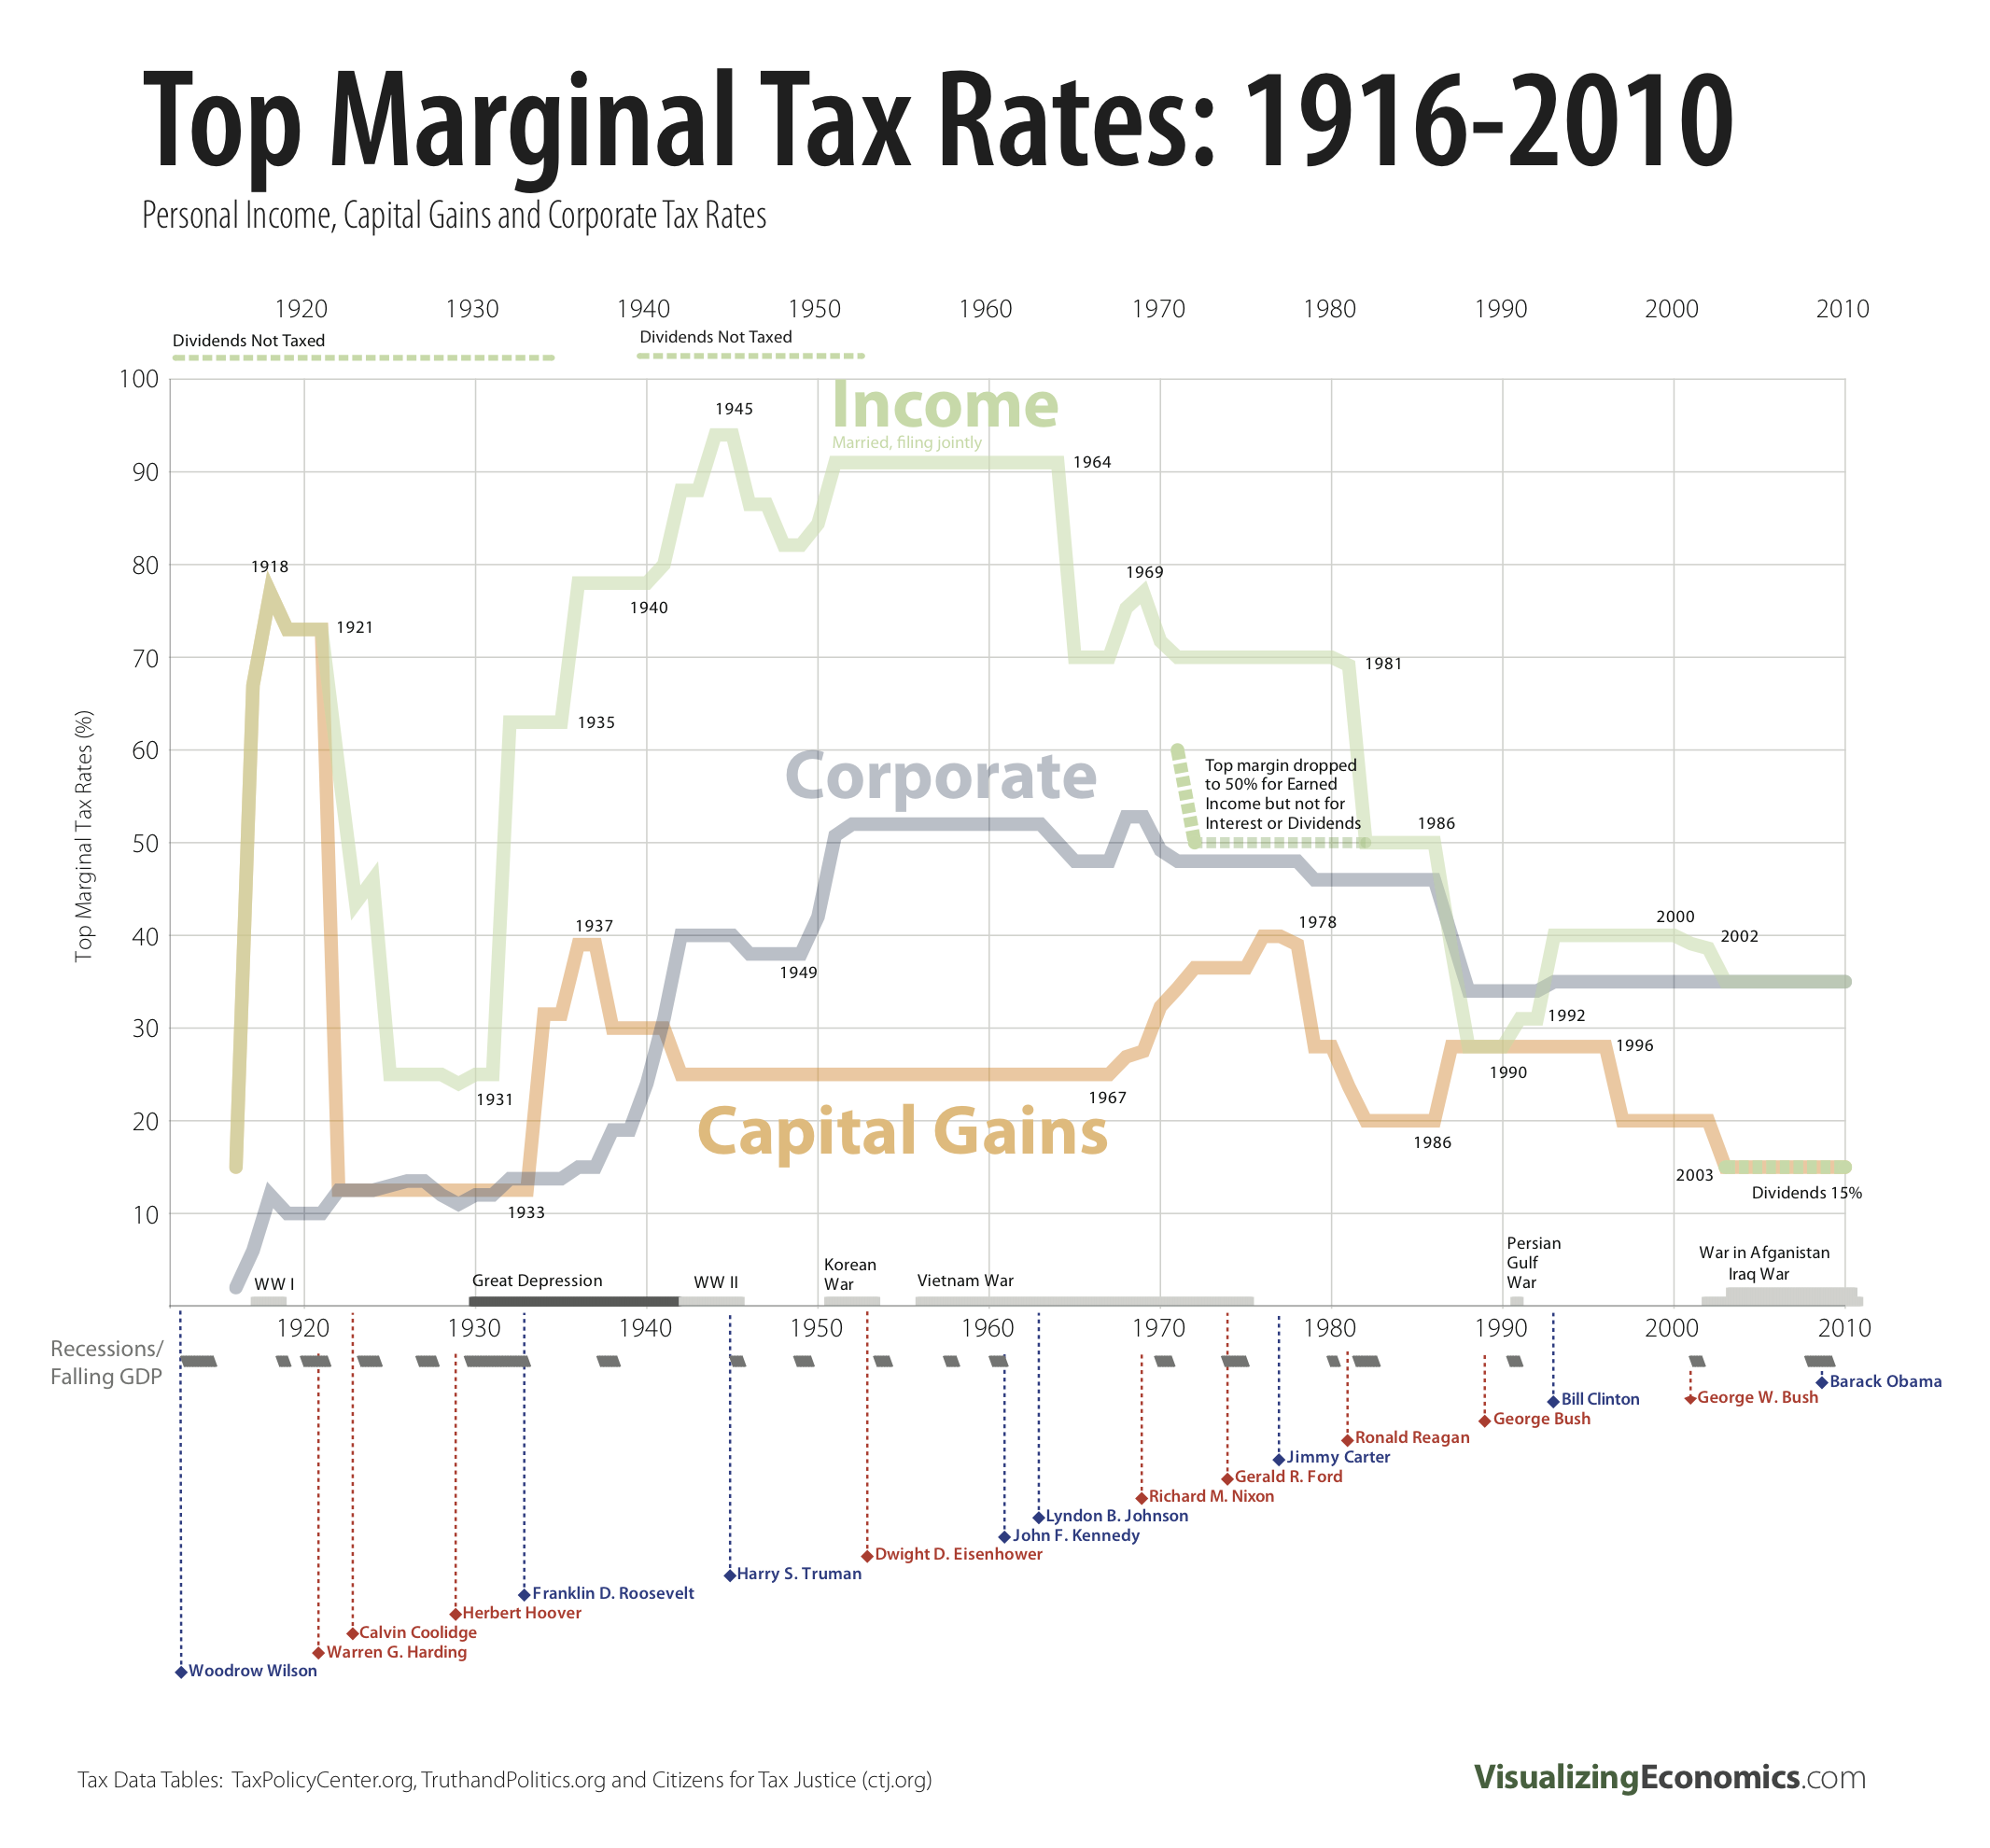
The green line labeled “income” correlates to the chart above. You can see that especially income, but also corporate and capital gains top tax rates, have been shockingly variable since 1910. They were about 25% right before the Great Depression, raised to about 95% during World War II, dropped to about 70% in the ’60s, and have been on the decline ever since.
Matthews refers to a pair of economists, Nobel laureate Peter Diamond and Emmanuel Saez, who argue that the top tax rate should optimally be 73%. Sociologist Jose Marichal, however, at ThickCulture, observes that tax policy has rarely been about what is optimal for society. Instead, he writes:
What these wild shifts in tax policy suggest is that our determination of how much we should tax our wealthiest is not based on any pragmatic assessment of what would result in the best policy outcome, but is rather guided by foundational assumptions about what is fair.
Beliefs about what is fair are, of course, strongly influenced by cultural ideologies and group stereotypes. Politicians both fall victim to their own biases and strategically invoke and create ideas and resentments. We shouldn’t expect the current debate over how to change our tax code to be either rational or practical, then. The debate will be political, but you already knew that.
Lisa Wade, PhD is an Associate Professor at Tulane University. She is the author of American Hookup, a book about college sexual culture; a textbook about gender; and a forthcoming introductory text: Terrible Magnificent Sociology. You can follow her on Twitter and Instagram.


