economics: great recession

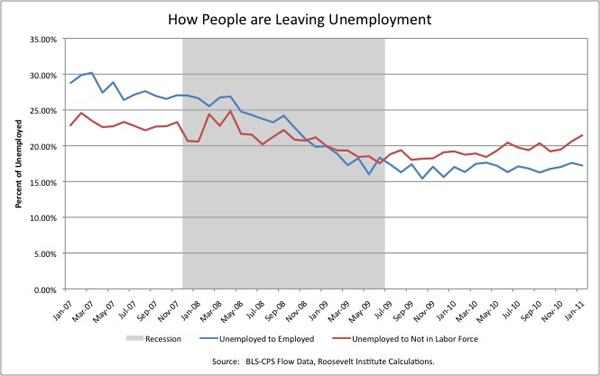
You may have heard the good news last week that Bureau of Labor Statistics reports that the U.S. unemployment rate dropped to 9.0% in January, combined with the somewhat conflicting news that payrolls increased by only 36,000 jobs. How is unemployment dropping without a significant increase in the number of people working?

Talking Points Memo posted a graph that gives some insight, and it isn’t encouraging. The blue line shows the % of unemployed who stopped counting as unemployed because they found work. The red line, on the other hand, shows the % of unemployed workers who quit being unemployed because they have stopped looking for work, and thus are categorized as “not in the labor force” rather than unemployed. Currently, more of the drop in unemployment rates are due to people giving up on finding work rather than them finding jobs (via Rortybomb):

The Roosevelt Institute has a detailed report about trends in unemployment.

This pattern has significant long-term consequences, since a period of unemployment has serious negative effects on individuals’ income for years even after they do finally get jobs. This impacts not just individuals and their families, but entire communities, counties, and states, which suffer from the increased need for services, lowered productivity, and loss of tax revenue.

Michael Konczal summarizes a depressing story for today’s unemployed and all of us in nations hardest hit by the current recession (via ginandtacos).

Till von Wachter, Jae Song and Joyce Manchester show that unemployment’s negative effect on your pocketbook persists long after re-employment. The figure below shows what happened to the incomes of people who did and did not lose their job during the 1982 recession. It shows that those that lost their jobs (the grey line) saw a decrease in earnings that has yet to recover. Controlling for inflation, on average the unemployed make less now than they did before they lost their jobs 20 years ago.

Quotes Konczal:

…the net loss to a displaced worker with six years of job tenure is approximately $164,000, which exceeds 20 percent of the average lifetime earnings of these workers. These future earnings losses dwarf the losses associated from the period of unemployment itself.

This same pattern can be found at the society level. Michael Greenstone and Adam Looney made the same comparison across countries that were hit the hardest by the recession (purple line) and countries hit less hard (green line). The incomes of individuals in the hardest hit nations were harmed long-term:

Greenstone and Looney show the same pattern for the unemployment rate:

Lisa Wade, PhD is an Associate Professor at Tulane University. She is the author of American Hookup, a book about college sexual culture; a textbook about gender; and a forthcoming introductory text: Terrible Magnificent Sociology. You can follow her on Twitter and Instagram.

Kelsey C., a master’s student at the University of Colorado-Boulder, sent in this image from Calculated Risk showing the percent of jobs lost in each recession since 1948, relative to the peak of the pre-recession job market. In terms of the percent of jobs lost, the current recession is by far the worst we’ve seen since World War II:

The Bureau of Labor Statistics has a detailed report on employment (or the lack thereof) as of October 2010 available — including information on length of unemployment, numbers working part-time because they can’t find full-time work, labor force participation broken down by race/ethnicity, sex, and educational attainment, Veteran status, disability status, and more!

The two google maps below — showing Las Vegas and Laguna Woods — help us understand the extent of the foreclosure crisis in the U.S. (at HuffPo).    Each red dot represents a foreclosure.

Las Vegas, NV:

Laguna Woods, CA:

These illustrations are nicely complemented by our posts featuring the empty housing grids of California City andhalf-home foreclosures, or the dilemma of the duplex.

Lisa Wade, PhD is an Associate Professor at Tulane University. She is the author of American Hookup, a book about college sexual culture; a textbook about gender; and a forthcoming introductory text: Terrible Magnificent Sociology. You can follow her on Twitter and Instagram.

According to a story on NPR, Asian Americans are less likely to be unemployed than White, Black, and Hispanic Americans.  But, when they do lose a job, they remain unemployed significantly longer.

Jobless Rates by Race:

Length of Unemployment:

Why might Asians have a more difficult time finding work?  Kent Wong of  UCLA’s Center for Labor Research and Education explains that their extended length of unemployment can be attributed to a confluence of two realities that make their situation unique.  First,about 70% of Asian Americans are foreign born and these immigrants often live in ethnic enclaves (e.g., Chinatowns) that focus on a single industry.  So long as there is work in that industry, Asians can find work.  But, if that industry goes south, their limited network outside of those enclaves becomes a hindrance.  Meanwhile, Asians (unlike Whites, Hispanics, and Blacks) tend to be segregated by language.  Wong explains that, with about a dozen languages spoken widely in the Asian American community, pan-ethnic networks can be difficult to build and maintain.  This leads to extra difficulty finding a new job:

If you have a Vietnamese employee working for a Vietnamese employer in Little Saigon in Orange County, that does not transfer to an ability to get a job in Koreatown in Los Angeles…

Both residential and linguistic segregation, then, contribute to long periods of unemployment for Asian Americans.

Lisa Wade, PhD is an Associate Professor at Tulane University. She is the author of American Hookup, a book about college sexual culture; a textbook about gender; and a forthcoming introductory text: Terrible Magnificent Sociology. You can follow her on Twitter and Instagram.

Rick T. sent in a link to a post at Global Research about some new U.S. Census data about 2009 poverty rates. As is usually true, children suffer higher levels of poverty than other age groups:

Poverty is significantly higher for African Americans than for the U.S. population overall — notice the Y axis goes up to 45%, whereas above it ends at 30%:

From the post:

Being American gives you a one in seven chance of being poor. Being young raises this chance to one in four. Further, being black in America means a one in four chance of being poor. Being young and black raises your chance of being poor up to one in 2.5.

Not surprisingly, poverty is highly related to education level:

I went to the original Census report and grabbed some more images. This graph makes the over-representation of children among the poor even more obvious:

There’s tons of information in the report if you’re interested in the demographics of poverty in the current economic recession.

At Family Inequality, Philip Cohen argues that the rising cost of higher education may be directly related to the cost of homes. In the figure below, he shows that housing prices and college tuition have risen in tandem, at least until recently:

Cohen doesn’t chalk this up to simple inflation influencing both trends. Instead, he argues…

…the connection between home wealth and college attendance was sometimes direct, as when experts advised parents to use home equity loans to send their kids to college (advice you don’t hear so much these days). But even without home equity loans, the wealth stored in middle-class homes — for most such families their largest asset — underwrote millions of college educations.  I guess you could say the federal policies promoting homeownership were big boons for the higher education industry, not just the GIs and mostly-white suburbanites who landed inside the picket fences.

That is, rising home prices meant that people who could afford those homes could pay more for their children’s college educations.  The price of college, then, could afford to increase without pricing out all those middle- and upper-class families.

Cohen asks for ideas about what will happen now that home prices have dipped and the cost of higher education continues to rise.

Lisa Wade, PhD is an Associate Professor at Tulane University. She is the author of American Hookup, a book about college sexual culture; a textbook about gender; and a forthcoming introductory text: Terrible Magnificent Sociology. You can follow her on Twitter and Instagram.

One thing we’ve been interested in, and posted various images about, here at Soc Images is the different ways people experience the current economic crisis. Obviously people will suffer more or less depending on their personal situations — if they had any savings, if they lose their jobs or not, if there are other wage-earners in the household, and so on. While we’re all affected by the recession at least indirectly, for some it’s a much more immediate personal problem than for others. And demographic factors outside our control, such as race/ethnicity, gender, and so on, play a large role in the distribution of the negative impacts (or, for some, the positive ones) of the recession.

Dmitriy T.M. sent in a story from the NYT that looks at the particular hardships faced by older workers. I’m interested in the graph on the left below, which shows historic jobless rates for those over age 55:

On the one hand, the unemployment rate for that group (7.3%) is certainly higher than at any point since the mid-’70s. On the other hand, the jobless rate for 55+ -year-old workers is lower than the overall unemployment rate right now, which is still hovering at about 9.6% (Bureau of Labor Statistics). It’s a case of the decontextualized graph: one that isn’t technically misleading, and that presents data in a straightforward manner, but that, without providing comparisons to other groups, makes it hard to know what to think about the data.

That’s not to discount the difficulties experienced by workers over age 55; it’s surely not comforting to know that the unemployment rate for your age group is below the national average if you, yourself, lose your job. And the graph on the right presents another aspect of joblessness: how long it lasts. When workers over 55 lose their jobs, it tends to take them quite a bit longer to find a new one. As the NYT article points out, with the overall higher rates of unemployment for all age groups, that gap becomes increasingly important: “because it will take years to absorb the giant pool of unemployed at the economy’s recent pace, many of these older people may simply age out of the labor force before their luck changes.” At the same time, the hits many retirement accounts have taken is pushing more people over age 65 to look for work, while others are forced into early retirement simply because they can’t find jobs.

More on race, age, gender, and the recession here.