
You may have heard the good news last week that Bureau of Labor Statistics reports that the U.S. unemployment rate dropped to 9.0% in January, combined with the somewhat conflicting news that payrolls increased by only 36,000 jobs. How is unemployment dropping without a significant increase in the number of people working?
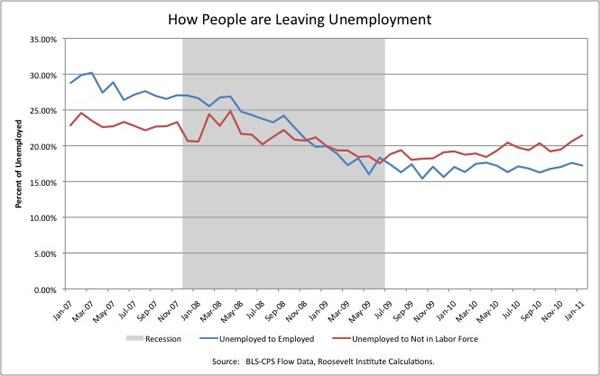
Talking Points Memo posted a graph that gives some insight, and it isn’t encouraging. The blue line shows the % of unemployed who stopped counting as unemployed because they found work. The red line, on the other hand, shows the % of unemployed workers who quit being unemployed because they have stopped looking for work, and thus are categorized as “not in the labor force” rather than unemployed. Currently, more of the drop in unemployment rates are due to people giving up on finding work rather than them finding jobs (via Rortybomb):
The Roosevelt Institute has a detailed report about trends in unemployment.
This pattern has significant long-term consequences, since a period of unemployment has serious negative effects on individuals’ income for years even after they do finally get jobs. This impacts not just individuals and their families, but entire communities, counties, and states, which suffer from the increased need for services, lowered productivity, and loss of tax revenue.
Comments 5
Paul — February 11, 2011
Interesting. And the opposite can also be true. Not all of the growth of unemployment is because more people have lost their jobs. Part of it can be because more people have entered "labour force".
katerina — February 11, 2011
I thought unemployment statistics go down as people are denied the ability to continue to collect. Some people are denied the ability to collect because they are not able to supply proof of minimum job-search contacts per week, while others have used up all their extensions and still don't have a job. It doesn't mean they have stopped looking, it just means they aren't counted as "unemployed," usually meaning people who are able to collect Unemployment Insurance. If you are no longer able to collect, but are still not employed and are still looking for a job, the number of jobs filled only goes up slightly because those people are still not hired, but not able to be counted as "unemployed".
I don't know how otherwise they are getting the numbers, or how they consider "no longer collecting unemployment" as equal to either having a job or not looking for a job. Extensions run out and you still have to look, but that doesn't seem to be accounted for on the graph; it's either have a job or stopped looking.
shale — February 12, 2011
This is a really important topic, especially given all the attention that unemployment rates are getting in the news these days.
A few months ago, maybe a year ago, you guys posted on unemployment rates among people of different ethnicities and ages. I can't remember off the top of my head, but the unemployment rate among young male people of colour was astronomical. A lot of people see that and think, "Well those lazy inner-city kids don't really work anyways." Except we're not talking about the "lazy kids"---we're not talking about all the kids. We're only talking about the fraction of kids that are motivated and looking for work. When you realize that the most ambitious among them might be staring down a 50-75% employment rate, it isn't surprising at all that so many of them aren't all that interested.
I would like to challenge anyone reading this to try and imagine what encountering a 50-75% employment rate might feel like. Keep in mind that chances are you've never had to deal with more than 10-15%. How much did that suck?