economics: great recession

Cross-posted at Reports from the Economic Front.

There is big trouble brewing in Europe.  John Ross, in his blog Key Trends in the World Economy, highlights this brewing crisis in a series of charts, some of which I repost below.

This first chart shows the extent of the recovery from the recent economic crisis in the U.S., the EU, and Japan.  While the U.S. GDP has finally regained its past business cycle peak, the same cannot be said for Europe (or Japan).  As of the 3rd quarter 2011, EU GDP was still 1.7% below its previous business cycle peak.  The Eurozone was 1.9% below.

Recent GDP estimates for the 4th quarter show European GDP once again contracting, which strongly suggests that the region is headed back into recession without having regained its previous business cycle peak.  This development implies that Europe faces serious stagnationist pressures.

gdp1.jpg

This chart looks at the growth record for the 5 largest European economies.  Germany has regained its previous GDP peak.  France is making progress toward that end.  These two countries account for 36.2% of European GDP.  However, things are quite different for the UK, Italy, and Spain.  These three countries account for 34.7% of European GDP and not only do they each remain far below their respective previous GDP peaks, their economies are once again heading downward.

gdp2.jpg

The third chart highlights the economic performance of the three countries which have received the most media attention because of fears that their governments will be unable to repay their respective debts.  They are clearly in trouble, adding to the downward pressure on European GDP.  However, despite all the attention paid to them, their combined economies are only one-eighth the size of the combined economies of the UK, Italy and Spain.

gdp3.jpg

The next two charts highlight the fact that economic trends are also dire throughout much of Eastern Europe.

gdp4.jpg

gdp5.jpg

The take-away is that European economic problems are not limited to a few smaller countries.  Some of the largest are also performing poorly and apparently headed back into recession without ever having regained their past business cycle peaks.  It is hard to see Europe escaping recession.  And it is hard to see the U.S., Asia, and Africa escaping the consequences.

A new study shows that owners of run-down apartment buildings are selling them to each other  “in a criminal conspiracy to avoid having to do the legally required maintenance necessary to keeping their buildings habitable and safe” (BoingBoing).

A tenant advocate was working with the city to document unsafe living conditions in apartments — things like leaking sewage and lead levels that were causing mental retardation — and get the owners of the buildings to make repairs  “But every time documented problems were delivered to the current LLC [Limited Liability Company] owners by city officials,” the report says, “nothing would happen.”

When the city’s deadline approached to fix the violations, the old LLC owner would explain that the property had changed hands and they were no longer involved. The buildings continued to deteriorate as owner after owner avoided addressing the violations.

In fact, the buildings were shifting hands within an extended family.  Confirming the connections between the various landlords proved that “…properties exchanged hands not as independent and valid real estate investments but as a conspiracy to avoid fixing the building violations.”

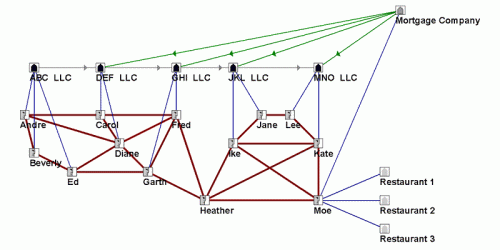
So, it went something like this. The building was passing from one LLC to another:

But all the LLCs were controlled by people connected to one other:

So the family had found a way around the law, “allowing the owners to ‘strip mine’ the equity from the buildings,” while leaving tenants in dangerous conditions.

The authors of the report call this a “common slumlord modus operandi.”  You should read the whole thing; it’s pretty stunning.

Lisa Wade, PhD is an Associate Professor at Tulane University. She is the author of American Hookup, a book about college sexual culture; a textbook about gender; and a forthcoming introductory text: Terrible Magnificent Sociology. You can follow her on Twitter and Instagram.

Shamus Khan posted a link to a great slideshow put together by the Business Insider that summarizes the current state of our economy. It’s a one-stop illustration of, in their words, “What the Wall Street protestors are so angry about,” and definitely worthy of clicking over to see the whole thing. I’m posting just a few of the images here.

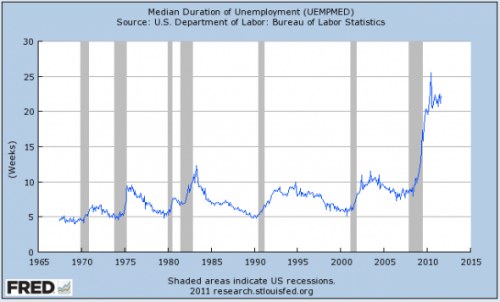
The median length of unemployment for those who lose their jobs is now over 20 weeks:

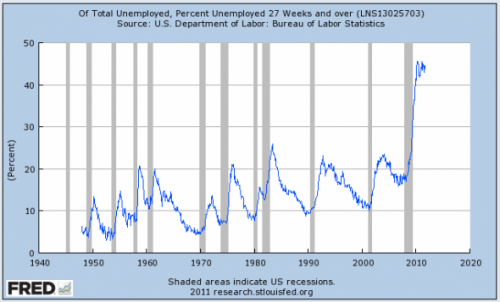
About 45% of the currently unemployed have been without a job for at least 27 weeks — six to seven months without a job:

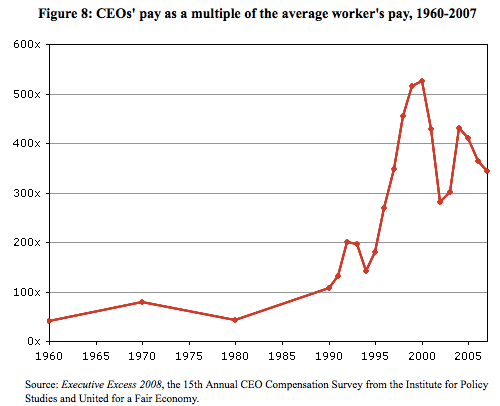
CEO pay is now roughly 350 times higher than the average worker’s:

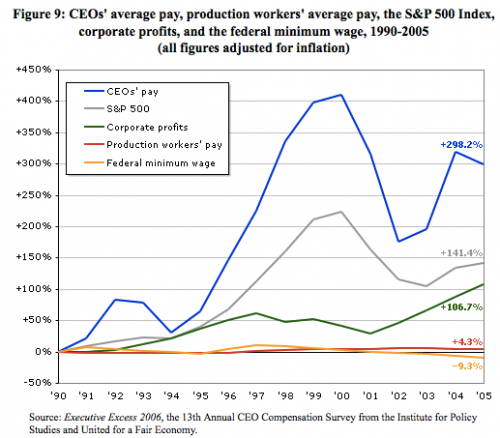
And CEO pay has grown dramatically since the early ’90s, though production workers’ pay has barely budged and the minimum wage has actually dropped if you adjust for inflation:

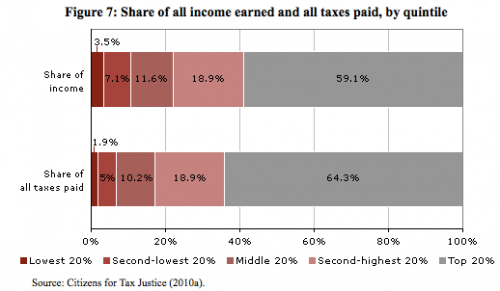
We often hear that the extremely wealthy pay a very disproportionate amount of U.S. taxes. It is true that they pay a large share. But it’s not so imbalanced compared to how much of all income they earn. For instance, the richest 20% of earners receive 59.1% of all U.S. income but pay 64.3% of taxes:

There’s much, much more in the full slideshow; go check it out.

An April 2011 Gallup poll found that 29% of Americans thought that the U.S. economy was in a depression.  Another 26% thought it was only a recession.   This is scary since, according to the National Bureau of Economic Research, we have been in an economic expansion since June 2009.

Why would so many Americans feel this way you might ask.  Here is one reason.  According to recent Census Bureau data, during the recession, which lasted from December 2007 to June 2009, inflation-adjusted median household income fell by 3.2%.  Between June 2009 and June 2011, a period of economic expansion, inflation-adjusted median household income fell by 6.7%.   This decline is illustrated in the New York Times chart below.

1010-nat-incomeweb.jpg

I recently appeared on the Alliance for Democracy’s “Populist Dialogue” TV show to talk about our economic crisis and possible responses to it.  You can watch the show here or below.

Everyone says that they want an economic recovery.  So, why don’t we have one?  Most surveys of business people tell the same story: there is no recovery because business owners are unwilling to hire and they are unwilling to hire because people are not spending.

So, why aren’t people spending?  One reason is that many people are unemployed.  Another reason, one that business leaders doesn’t like to discuss, is that business has been boosting its profits by cutting worker pay.  And not just for the less educated who are said to be the unfortunate victims of technology and globalization.  Rather, as the chart below shows, for workers in almost all educational categories.

na-bn371_census_g_20110919135704.jpg

The average earnings of workers in almost all educational categories declined between 2000 and 2010.  Talk about a lost decade for working people!  Only those with an MD, JD, MBA or PhD enjoyed a real increase over the period, and those workers make up only 3% of the workforce.

The average earnings of college graduates, 19.5% of the workforce, declined (adjusted for inflation) by approximately 8%.  Interestingly, the average earnings of high school graduates, 30.7% of the workforce, actually suffered a smaller decline.

These numbers make clear that the solution to our economic problems is not more education.  Even those with Masters Degrees lost money on average.  Recovery will require real structural change in the way our economy operates.

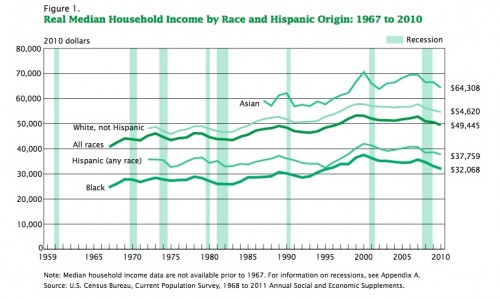
The Census Bureau just published new data revealing trends in living standards as of 2010.  The trends are troubling to say the least. Median household income (adjusted for inflation) fell to $49,445.  That means that the median household now earns less than it did a decade ago.  This marks the first decade since the Great Depression without an increase in real median income.

According to Lawrence Katz, a labor expert and Harvard economist:

This is truly a lost decade.  We think of America as a place where every generation is doing better, but we’re looking at a period when the median family is in worse shape than it was in the late 1990s.

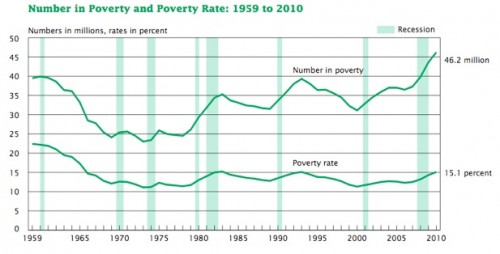
The percentage of Americans living in poverty hit 15.1 percent, the highest percentage since 1993.  There are now 46.2 million people living below the poverty line, the greatest number ever recorded by the Census Bureau. Child poverty stood at 22 percent.

Things are unlikely to get better this year.  State and local governments are slashing employment and programs and the federal government is now moving into cutting mode itself.

This depressing situation is not simply a recession phenomenon.  As the New York Times reports, the expansion period of 2001 to 2007 “was the first… on record where the level of poverty was deeper, and median income of working-age people was lower, at the end than at the beginning.”

Of course, while the great majority of people are struggling, a small minority have been doing very well.  One consequence, as the chart below highlights, is a strong growth in inequality (as measured by the Gini coefficient with higher numbers reflecting greater inequality).  As I noted in a previous post, over the years 2002 to 2007, the top 1% of households captured 58% of all the income generated.

inequality-2.jpg


In brief, there is a small minority that is doing very well and a great majority that is struggling, with a significant number in free fall.

The Atlantic posted several graphs from a recent Census Bureau report on income and poverty as of 2010. The racial differences in median household income are truly awful; half of African American families make less than $32,000 a year. Stop and just seriously think, for a second, about the dramatic difference in access to resources — decent housing, some savings for emergencies, retirement accounts, etc. — these numbers translate into:

Not surprisingly, the percentage of Americans falling below the poverty line rose:

For more on income, poverty, and health insurance coverage, check out the full Census Bureau report.

A longer version is cross-posted at Montclair SocioBlog.

Long before the Freakonomics guys hit the best seller list by casting their economic net in sociological waters, there was Gary Becker.  If you want to explain why people (some people) commit crimes or get married and have babies, Becker argued, just assume that people are economically rational.  Follow the money and look at the bottom line.  You don’t need concepts like culture or socialization, which in any case are vague and hard to measure.*

Becker wrote no best-sellers, but he did win a Nobel.  His acceptance speech: “The Economic Way of Looking at Behavior.”

In a Wall Street Journal op-ed Friday about the recession, Becker started off Labor Day weekend weighing in on unemployment and the stalled recovery.  His explanation: in a word, uncertainty.

These laws [financial regulation, consumer protection] and the continuing calls for additional regulations and taxes have broadened the uncertainty about the economic environment facing businesses and consumers. This uncertainty decreased the incentives to invest in long-lived producer and consumer goods. Particularly discouraged was the creation of small businesses, which are a major source of new hires.

There’s something curious about this.  Becker pushes uncertainty to the front of the line-up and says not a word about the usual economic suspects – sales, costs, customers, demand.  It’s all about the psychology of those in small business, their perceptions and feelings of uncertainty.  Not only are these vague and hard to measure, but as far as I know, we do not have any real data about them.  Becker provides no references.  The closest thing I could find was a small business survey from last year, and it showed that people in small business were far more worried about too little demand than about too much regulation.

Compared with Regulation, twice as many cited Sales as the number one problem.  (My posts on uncertainty from earlier this summer are here and here.)

In addition, the sectors of the economy that should be most uncertain about regulation – finance, mining and fuel extraction, and medical care – are those where unemployment is lowest.

More, as David Weidner writes in the Wall Street Journal, taxes, interest rates, and regulation at an all-time low.

[The uncertainty-about-taxes-and-regulation argument] would make more sense if, say, taxes were already high and might be going higher or regulatory burdens were heavy and might be getting heavier. But when taxes are at a 60-year low and the regulations are pretty much the same as they were in the 1990s boom, the argument makes no sense at all (Mark Thoma quoting an e-mail from Gary Burtless).

If it’s really uncertainty caused by these things that causes a reluctance to hire, the time to invest and hire should be now.

—————————

* This is an oversimplified version, but it will do for present purposes.