economics: great recession

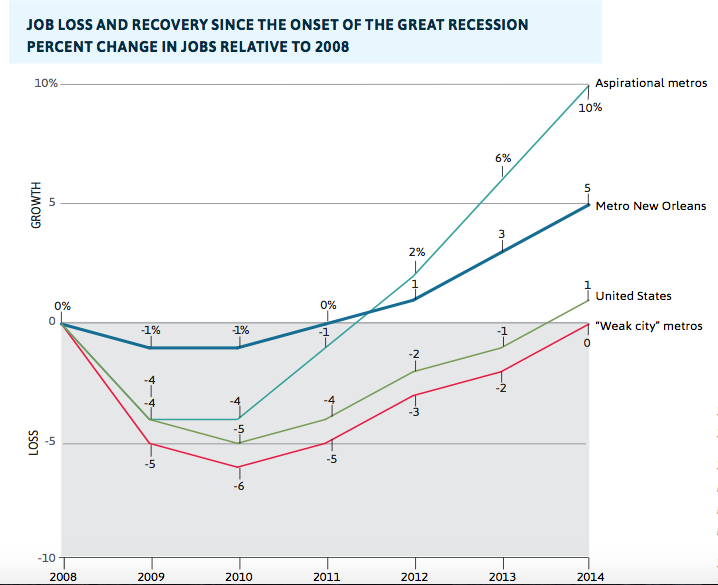
Generally, residents of New Orleans are “remarkably optimistic” about its recovery and future. Partly because the city had just begun to recover from Hurricane Katrina when the Great Recession began, it suffered less job loss relative to its pre-recession state and GDP actually grew 3.9% between 2008 and 2011. No other southern metropolitan area cracked 2% in the same period.

Richard Webster, writing for nola.com, offers the following evidence of New Orleans’ resilience in the face of the Great Recession. Chart 1 shows that it lost a smaller percentage of its jobs than the U.S. as a whole.

19


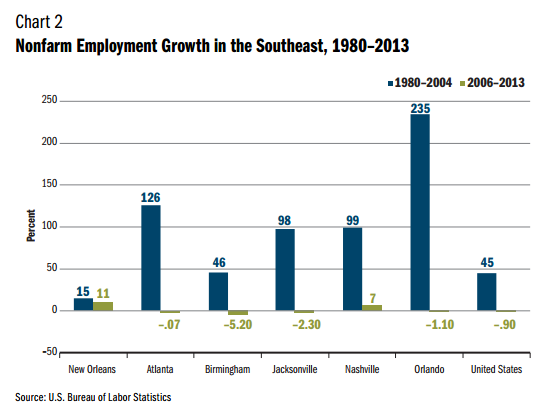
This is even more significant as it looks, as New Orleans had been in economic decline for decades before Katrina. At EconSouth, Charles Davidson reports that “the economy in New Orleans has reversed decades of decline and outperformed the nation and other southern metropolitan areas. Consider: the job growth in New Orleans shown in Chart 2 may not look impressive, but compare it to the declines of its neighbors (blue is before Katrina, green is after).

2

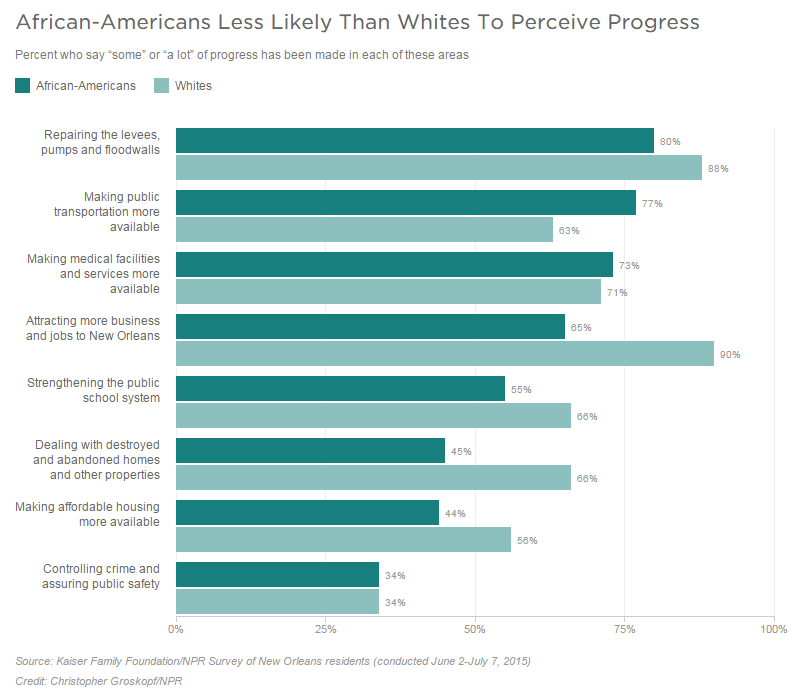
Residents seem to feel that the city is doing well, with the stark exception of fear of crime. But white residents are much happier with the state of the city than the 60% of residents who identifies as African American (image via NPR). This likely reflects the widening wealth gap in the city post-Katrina.

3

New Orleans continues to face serious problems, including low wages, a widening wealth gap, an evisceration of the public schooling system, underfunded higher ed, high crime, negative effects of gentrification, and the looming threat of another storm. Still, thanks to greater diversification of its economy, entrepreneurship, record tourism, and rising investment money, many are arguing that the city is in the midst of a revival.

Lisa Wade is a professor of sociology at Occidental College. She writes about New Orleans here. You can follow her on Twitter and Facebook.

The U.S. once led the world in middle class affluence, but thanks to a recovery from the Great Recession that involves giving all the money to the already-rich, we’re losing that distinction.

“In 1960,” said Harvard economist Lawrence Katz, “we were massively richer than anyone else. In 1980, we were richer. In the 1990s, we were still richer.”

Not so much anymore. This chart shows that many countries have been closing the gap.

9

Good for them, of course, but the American middle class is struggling, too. Pew Research Center demographer Conrad Hackett summed it up:

8

Lisa Wade, PhD is an Associate Professor at Tulane University. She is the author of American Hookup, a book about college sexual culture; a textbook about gender; and a forthcoming introductory text: Terrible Magnificent Sociology. You can follow her on Twitter and Instagram.

I wrote this for The Conversation. Read the original here.

Observers may be quick to declare social trends “good” or “bad” for families, but such conclusions are rarely justified. What’s good for one family – or group of families – may be bad for another. And within families, interests do not always align. Divorce is “bad” for a family in the sense of breaking it apart, but it may be beneficial, or even essential, for one or both partners or their children.

This kind of ambiguity makes it difficult to assess what kind of impact the recent recession and its aftermath had on families. But for researchers, at least, it offers a lot of job security – so many questions, so much going on. In any case, here’s where we stand so far.

The effect of the Great Recession on family trends in the United States has been dramatic with regard to birth rates and divorce, and has been strongly suggestive of family violence, but less clear for marriage and cohabitation.

Marriage rates declined, and cohabitation rates increased, but these trends were already underway, and the recession didn’t alter them much. When trends don’t change direction it’s difficult to identify an effect of a shock this broad. However, with both birth rates and divorce, clear patterns emerged.

Birth rates: a sharp drop

The most dramatic impact was on birth rates, which dropped precipitously, especially for young women, as a result of the economic crisis. How do we know? First, the timing of the fertility decline is very suggestive. After increasing steadily from the beginning of 2002 until late 2007, birth rates dropped sharply. (The decline has since slowed for some groups after 2010, but the U.S. still saw record-low birth rates for teenagers and women ages 20-24 as late as 2012.)

Second, the decline in fertility was steeper in states with greater increases in unemployment. Although we don’t have the data to determine which couple did or did not have a child in response to economic changes, this pattern supports the idea that financial concerns convinced some people to not have a child.

That interpretation is supported by the third trend: the fertility drop was more pronounced among younger women – and there was no drop at all among women over 40. That may mean the fertility decline represents births postponed by families that intend to have children later – an option older women may not have – which fits previous research on economic shocks.

It seems likely that people who are on the fence about having a baby can be swayed by perceived financial hardship or uncertainty. From research on 27 European countries, we know that people with troubled family financial situations are more likely to say they are unsure whether they will meet their stated childbearing goals – that is, economic uncertainty doesn’t change their familial aims but may increase uncertainty in whether they will be met.

However, some births delayed inevitably become births foregone. Based on the effect of unemployment on birth rates in earlier periods, it appears a substantial number of young women who postponed births will end up never having children. By one estimate, women who were in their early 20s during the Great Recession are projected to have some 400,000 fewer lifetime births and an additional 1.5% of them will never have a birth.

Divorce rates: a counter-intuitive reaction

In the case of divorce, the pattern is counter-intuitive. Although economic hardship and insecurity adds stress to relationships and increases the risk of divorce, the overall divorce rate usually drops when unemployment rates rise.

Researchers believe that, like births, people postpone divorces during economic crises because of the costs of divorcing – not just legal fees, but also housing transitions (which were especially difficult in the Great Recession) and employment disruptions.

My own research found that there was a sharp drop in the divorce rate in 2009 that can reasonably be attributed to the recession. But, as we suspect will be the case with births, there appears to have been a divorce-rate rebound in the years that followed.

Domestic violence: a spike along with joblessness

Family violence has become much less common since the 1990s. The reasons are not entirely clear, but they certainly include the overall drop in violent crime, improved response from social service and non-governmental organizations, and improvements in women’s relative economic status. However, when the recession hit there was a spike in intimate-partner violence, coinciding with the sharp rise in men’s unemployment rates (I show the trends here).

As with the other trends, it’s hard to make a case based on timing alone, but the evidence is fairly strong that the economic shock increased family stress and violence. For example, one study showed that mothers were more likely to report spanking their children in the months when consumer confidence fell. Another study found a jump in abusive head trauma cases during the recession in several regions. And there have been many anecdotal and journalist accounts of increases in family violence, emerging as early as 2009. Are these direct results of the economic stress or mere correlation? It’s hard to say for sure.

The ultimate impact of these trends on American families will likely take years to emerge. The recession may have affected the pattern of marriage in ways we don’t yet understand – how couples selected each other, who got married and who didn’t – and may create measurable group of marriages that are marked for future effects as yet unforeseen. Like the young adults who entered the labor market during the period of high unemployment and whose career trajectories will be forever altered unfavorably, how these families bear the scars cannot be predicted. Time will tell.

Philip N. Cohen is a professor of sociology at the University of Maryland, College Park. He writes the blog Family Inequality and is the author of The Family: Diversity, Inequality, and Social Change. You can follow him on Twitter or Facebook.

Electing Republicans will certainly not improve things, but it is hard to blame people for feeling that the Democratic Party has abandoned them.

President Obama had hoped that recent signs of economic strength would benefit Democrats in the recently completed election.  Job creation has picked up, the unemployment rate is falling, and growth is stronger. Yet, most Americans have not enjoyed any real gains during this so-called expansionary period.

The following two charts highlight this on the national level.  The first shows how income gains made during the expansion period have been divided between the top 1% and everyone else.   There is not a lot to say except that there is not a lot of sharing going on.

1 (3) - Copy

The second shows trends in real median household net worth.  While declines in median net worth are not surprising in a recession, what is noteworthy is that median net worth has continued to decline during this expansion.  Adjusted for inflation the average household is poorer now than in 1989.

2

Oregon provides a good example of state trends.  The chart below shows that the poverty rate in Oregon is actually higher now than it was during the recession.

1 (4)

The poverty rate for children is even higher. In 2013, 21.6 percent of all Oregon children lived in families in poverty.

And, not surprisingly, communities of color experience poverty rates far higher than non-Hispanic whites.

1

More promising is movement building to directly advance community interests.  One example: voters in five states passed measures to boost minimum wages.   Another was the successful effort in Richmond, California to elect progressives to the city council over candidates heavily supported by Chevron, which hoped to dominate the council and overcome popular opposition to its environmental and health and safety policies.

Originally posted at Reports from the Economic FrontCross-posted at Pacific Standard.

Martin Hart-Landsberg is a professor of economics at Lewis and Clark College. You can follow him at Reports from the Economic Front.

Four years ago, twenty-three economists (mostly conservative) signed a letter to Ben Bernanke warning that the Fed’s quantitative easing policy – adding billions of dollars to the economy – would be disastrous. It would “debase the currency,” create high inflation, distort financial markets, and do nothing to reduce unemployment.

Four years later, it’s clear that they were wrong (as Paul Krugman never tires of reminding us). Have they changed their beliefs?

Of course not.

Bloomberg asked the letter-signers what they now thought about their prophecy.  Here’s the headline: “Fed Critics Say ’10 Letter Warning Inflation Still Right.”
This despite the actual low inflation:

2
I don’t know why I assume that high-level economists would be more likely than some ordinary people to change their ideas to adjust for new facts. Fifty years ago, in The Structure of Scientific Revolutions, Thomas Kuhn showed that even in areas like chemistry and physics, scientists cling to their paradigms even in the face of accumulated anomalous facts. Why should big-shot economists be any different? It also occurs to me that it’s the most eminent in a profession who will be more resistant to change.  After all, it’s the people at the top who have the greatest amount invested in their ideas – publications, reputations, consultantships, and of course ego. Economists call these “sunk costs.”

So how do they maintain their beliefs?

Most of the 23 declined to comment; a few could not be reached (including Ronald McKinnon, who died the previous day).  Of those who responded, only one, Peter Wallison at the American Enterprise Institute, came close to saying, “My prediciton was wrong.”

“All of us, I think, who signed the letter have never seen anything like what’s happened here.”

Most of the others preferred denial:

“The letter was correct as stated.” (David Malpass. He worked in Treasury under Reagan and Bush I)

“The letter mentioned several things… and all have happened.” (John Taylor, Stanford)

“I think there’s plenty of inflation — not at the checkout counter, necessarily, but on Wall Street.” (Jim Grant of “Grant’s Interest Rate Observer.” Kinda makes you wonder how closely he’s been observing interest rates.)

Then there was equivocation. After Thursday night’s debacle – Giants 8, Pirates 0, knocking Pittsburgh out of the playoffs– someone reminded me, “Hey, didn’t you tell me that the Pirates would win the World Series?”

“Yes, but I didn’t say when.”

Some of the letter-signers used this same tactic, and just about as convincingly.

“Note that word ‘risk.’ And note the absence of a date.” (Niall Ferguson, Harvard)

“Inflation could come…” (Amity Shlaes, Calvin Coolidge Memorial Foundation)

The 1954 sociology classic When Prophecy Fails describes group built around a prediction that the world would soon be destroyed and that they, the believers, would be saved by flying saucers from outer space.  When it didn’t happen, they too faced the problem of cognitive dissonance – dissonance between belief and fact. But because they had been very specific about what would happen and when it would happen, they could not very well use the  denial and equivocation favored by the economists. Instead, they first by claimed that what had averted the disaster was their own faith. By meeting and planning and believing so strongly in their extraterrestrial rescuers, they had literally saved the world. The economists, by contrast, could not claim that their warnings saved us from inflation, for their warning – their predictions and prescriptions – had been ignored by Fed. So instead they argue that there actually is, or will be, serious inflation.

The other tactic that the millenarian group seized on was to start proselytizing – trying to convert others and to bring new members into the fold.  For the conservative economists, this tactic is practically a given, but it is not necessarily a change.  They had already been spreading their faith, as professors and as advisors (to policy makers, political candidates, wealthy investors, et al.). They haven’t necessarily redoubled their efforts, but the evidence has not given them pause.  They continue to publish their unreconstructed views to as wide an audience as possible.

That’s the curious thing about cognitive dissonance. The goal is to reduce the dissonance, and it really doesn’t matter how.  Of course, you could change your ideas, but letting go of long and deeply held ideas when the facts no longer co-operate is difficult. Apparently it’s easier to change the facts (by denial, equivocation, etc.). Or, equally effective in reducing the dissonance, you can convince others that you are right. That validation is just as effective as a friendly set of facts, especially if it comes from powerful and important people and comes with rewards both social and financial.

Jay Livingston is the chair of the Sociology Department at Montclair State University. You can follow him at Montclair SocioBlog or on Twitter.

The graph below represents the share of the income growth that went to the richest 10% of Americans in ten different economic recoveries.  The chart comes from economist Pavlina Tcherneva.

1 (2)

It’s quite clear from the far right blue and red columns that the top 10% have captured 100% of the income gains in the most recent economic “recovery,” while the bottom 90% have seen a decline in incomes even post-recession.

It’s also quite clear that the economic benefits of recoveries haven’t always gone to the rich, but that they have done so increasingly so over time. None of this is inevitable; change our economic policies, change the numbers.

Via Andrew Sullivan.

Lisa Wade, PhD is an Associate Professor at Tulane University. She is the author of American Hookup, a book about college sexual culture; a textbook about gender; and a forthcoming introductory text: Terrible Magnificent Sociology. You can follow her on Twitter and Instagram.

If the well-being of our children is an indicator of the health of our society we definitely should be concerned.  Almost one-fourth of all children in the U.S. live in poverty.

The Annie E. Casey Foundation publishes an annual data book on the status of American children.  Here are a few key quotes from 2014 (all data refer to children 18 and under, unless otherwise specified):

  • Nationally, 23 percent of children (16.4 million) lived in poor families in 2012, up from 19 percent in 2005 (13.4 million), representing an increase of 3 million more children in poverty.
  • In 2012, three in 10 children (23.1 million) lived in families where no parent had full-time, year-round employment. Since 2008, the number of such children climbed by 2.9 million.
  • Across the nation, 38 percent of children (27.8 million) lived in households with a high housing cost burden in 2012, compared with 37 percent in 2005 (27.4 million).

As alarming as these statistics are, they hide the terrible and continuing weight of racism.  Emily Badger, writing in the Washington Post, produced the following charts based on tables from the data book.

1 2 3

Children live in poverty because they live in families in poverty.  Sadly, despite the fact that we have been in a so-called economic expansion since 2009, most working people continue to struggle.  The Los Angeles Times reported that “four out of 10 American households were straining financially five years after the Great Recession — many struggling with tight credit, education debt and retirement issues, according to a new Federal Reserve survey of consumers.”

Martin Hart-Landsberg is a professor of economics at Lewis and Clark College. You can follow him at Reports from the Economic Front.

According to a June 2014 Russell Sage Foundation report, the average U.S. household experienced a real wealth decline of more than one-third over the 10 years ending in 2013.

Table 1 shows that the net worth of the median household fell from $87,992 in 2003 to $56,335 in 2013, for a decline of 36%.  In fact, the last ten years were hard on the overwhelming majority of American households.  Only the top 2 groups enjoyed wealth gains over the period.  Also noteworthy is the tiny net worth of households below the median.

1

Figure 1 provides a longer term perspective on wealth movements.  We can see that most households enjoyed growing wealth from 1984 to the 2007 crisis, with wealth falling across the board since.  However, the median household is now significantly poorer than it was in 1984.  Only the richer households managed to maintain most of their earlier gains in wealth.

2

These trends highlight the fact that we have a growing inequality of wealth, as well as of income, and they are not likely to reverse on their own.

Martin Hart-Landsberg is a professor of economics at Lewis and Clark College. You can follow him at Reports from the Economic Front.