economics: great recession

The Federal Reserve Bank has said it will maintain its stimulus policy as long as the economy remains weak. One of its key indicators for the strength of the economy is the unemployment rate, which has been steadily falling for several years, from 10% in October 2009 to 7.3% in August 2013.  However, this decline in the official unemployment rate gives a misleading picture of economic conditions, at least as far as the labor market is concerned.

The reason, as the Economy Policy Institute explains, is because of the large number of “missing workers.”  These missing workers are…

…potential workers who, because of weak job opportunities, are neither employed nor actively seeking a job. In other words, these are people who would be either working or looking for work if job opportunities were significantly stronger. Because jobless workers are only counted as unemployed if they are actively seeking work, these “missing workers” are not reflected in the unemployment rate.

We are seeing many more missing workers now than in recent history.  The chart below shows the Economic Policy Institute estimate for the number of missing workers.

missing workers_Page_1

 The next chart compares the estimated unemployment rate including missing workers (in orange) with the official unemployment rate (in blue).

unemployment rates_Page_1

As you can see, while the official unemployment rate continues to decline, the corrected unemployment rate remains stuck at a rate above 10%. In other words labor market conditions remain dismal. And here we are only talking about employment.  If we consider the quality of the jobs being created, things are even worse.

Martin Hart-Landsberg is a professor of economics at Lewis and Clark College. You can follow him at Reports from the Economic Front.

The great majority of Americans might find the post-recession expansion disappointing, but not the top earners.

The following table reveals that our economic system is operating much differently than in the recent past.  The rightmost column shows that the top 1% captured 68% of all the new income generated over the period 1993 to 2012, but a full 95% of all the real income growth during the 2009-2012 recovery from the Great Recession.  In contrast, the top 1% only captured 45% of the income growth during the Clinton expansion and 68% during the Bush expansion.

piketty_saez

Of that weren’t enough, the next chart offers another perspective on how well top income earners are doing. In the words of the New York Times article that included it:

…the top 10% of earners took more than half of the country’s total income in 2012, the highest level recorded since the government began collecting the relevant data a century ago… The top 1% took more than one-fifth of the income earned by Americans, one of the highest levels on record since 1913 when the government instituted an income tax.

We have a big economy.  Slow growth isn’t such a big deal if you are in the top 1% and 22.5% of the total national income is yours and you can capture 95% of any increase.  As for the rest of us…

One question rarely raised by those reporting on income trends: What policies are responsible for these trends?

Cross-posted at Reports from the Economic Front.

Martin Hart-Landsberg is a professor of economics at Lewis and Clark College. You can follow him at Reports from the Economic Front.

As the Wall Street Journal reports:

Four years into the economic recovery, U.S. workers’ pay still isn’t even keeping up with inflation. The average hourly pay for a nongovernment, non-supervisory worker, adjusted for price increases, declined to $8.77 last month from $8.85 at the end of the recession in June 2009, Labor Department data show.

In other words, as the chart below illustrates, the great majority of workers are experiencing real wage declines over this expansion”

image

Growth also remains sluggish, increasing “at a seasonally adjusted annual pace of less than 2% for three straight quarters — below the pre-recession average of 3.5%.”  But by intensifying the pace of work and reducing the pay of their employees, corporations have been able to boost their profits despite the slow growth.

The following chart from an Economic Policy Institute study shows the continuing and growing disconnect between productivity and private sector worker compensation (which includes wages and benefits) using two different measures of compensation.

epi trends

As the Economic Policy Institute study explains, “there has been no sustained growth in average compensation since 2004. The stagnation began even earlier, in 2003, when considering wages alone. Since 2003, wages as measured by both the ECI and the ECEC (not shown) have not grown at all — a lost decade for wages.”

The point then is that we need a real jobs program, one that is designed to create new meaningful jobs and boost the well-being of those employed.  Government efforts to sustain the existing expansion have certainly been responsive to corporate interests.  It should now be obvious that such efforts offer workers very little.

Martin Hart-Landsberg is a professor of economics at Lewis and Clark College. You can follow him at Reports from the Economic Front.

In the early 1990s, Bill Moyers began following two Milwaukee families, the Neumanns and the Stanleys, as they struggled to keep a foothold in the middle class in the face of economic changes that largely destroyed the city’s decently-paid, unionized manufacturing jobs. An earlier documentary, Surviving the Good Times, showcased the two incredibly hard-working families’ efforts to adapt to the new economic reality. Their stories highlight the difficulty of trying to achieve the American Dream on a series of jobs that rarely pay a living wage or offer any benefits.

And how about now? Twenty years after he first started following their lives, Moyers returned to Milwaukee to see how they had fared during the housing bubble and subsequent economic crisis. Two American Families shows the increasing economic precariousness each family experiences over two decades and the impacts this has on the opportunities they can provide their children. It’s a heartbreaking look at the effects of large-scale economic changes on individual families.

PBS has also posted interviews with a few of the family members about why they participated in the new film, as well as an update on how they’re doing since they were last filmed. And you can find a number of charts on the changing economy and its impacts on families here, and some data about Milwaukee specifically here.

Gwen Sharp is an associate professor of sociology at Nevada State College. You can follow her on Twitter at @gwensharpnv.

Cross-posted at Reports from the Economic Front.

Media and policy-makers seem anxious to convince us that the economy is in strong recovery mode, therefore, no further significant policy interventions are needed.

Their optimism appears to rest heavily on the recent acceleration in consumer spending.  After all, there are strong reasons for concern with the other major sources of growth:  government spending on all levels is being cut, exports face a weakening world economy, and business investment remains largely stagnate.

But there are also strong reasons to challenge this optimistic view of consumer spending as a growth engine.  The charts below, from a Wall Street Journal article, highlight some of the most important.

As we see below, while consumption spending is indeed accelerating, after tax personal income is falling.  In other words, there appears little reason to believe that there is a solid foundation for sustaining this trend.

1

Additionally, after four years of recovery we still have 2.4 million fewer jobs than we had at the start of the recession.  Moreover, as we see below, there has been no real wage growth.  In fact, real average wages have fallen for most of the so-called expansionary period.

2

Yes, housing values are finally starting to rise and household debt payments as a share of after-tax income are declining.  But to a large extent the new burst in consumption spending has more to do with renewed borrowing than solid gains in job creation and income.

Unfortunately, there is little reason for us to have confidence that the economy is gathering strength in ways that will be sustainable or benefit the great majority of working people.

Martin Hart-Landsberg is a professor of economics at Lewis and Clark College. You can follow him at Reports from the Economic Front.

Last week many media outlets were busy celebrating the Dow Jones record high, suggesting that it was indicative of the United States’ recovery from the greatest economic downturn since The Great Depression.  The graph below comes from a New York Times story with the headline “As Fears Recede, Dow Industrial Hits a Milestone.”

However, another story buried in the Business section of the New York Times, titled “Recovery in U.S. Is Lifting Profits, but Not Adding Jobs,” contains a graph illustrating how the supposed economic recovery is bitter-sweet at best:

2

The second graph uses data from the Bureau of Economic Analysis to highlight the fact that corporate profits and stock prices are at record highs, but the share of profits workers have taken home has steadily dropped since the early 1980s.  Some of the steepest declines have come during the last few years, or during the supposed “recovery.”

These two graphs illustrate that while ”The Market” is probably considered the go-to indicator of economic well-being, stock indexes are not always indicative of the economic reality experienced by non-investors.  If businesses and corporations were increasing their stock value by investing to expand productivity, thereby creating good-paying jobs and opportunities for workers, rising markets would be a sign good of economic times for all.  But this data suggests that is not what is happening; instead, as the twin charts show, rising corporate profits are at least partly the result of wage suppression.

Jason Eastman is an Assistant Professor of Sociology at Coastal Carolina University who researches how culture and identity influence social inequalities.

Cross-posted at Reports from the Economic Front.

The British economy is a disaster.  Oddly enough most analysts find it difficult to explain why.

Actually the reason is quite simple. The British government responded to its own Great Recession by cutting spending and raising taxes.  The result, which is anything but mysterious, is that the county remains in deep recession.

Matthew O’Brien, writing in The Atlantic, describes the situation as follows:

…public net investment — things like roads and bridges and schools,  and everything else the economy needs to grow — has fallen by half the past three years, and is set to fall even further the next two. It’s the economic equivalent of shooting yourself in both feet, just in case shooting yourself in one doesn’t completely cripple you. Austerity has driven down Britain’s borrowing costs even further, but that’s been due to investors losing faith in its recovery, rather than having more faith in its public finances. Indeed, weak growth has kept deficits from coming down all that much, despite the higher taxes and slower spending. In other words, it’s economic pain for no fiscal gain.

Below is a chart taken from The Atlantic article.  It shows that:

Britain’s stagnating economy has left it in worse shape at this point of its recovery than it was during the Great Depression. GDP is still more than 3 percent below its 2008 peak, and it hasn’t done anything to catchup in years. At this pace, there will be no recovery in our time, or any other time.

 gdp to december 2012

In other words, while the British economy suffered a deeper decline during the Great Depression period of 1930 to 1934 than to this point in the Great Recession which started in 2008, the economy recovered far more quickly then than now.  In fact, it doesn’t seem to be recovering now at all.

Perhaps the most surprising thing about the situation is that political leaders appear determined to stay the course.

Martin Hart-Landsberg is a professor of economics at Lewis and Clark College. You can follow him at Reports from the Economic Front.

Cross-posted at Montclair SocioBlog.

The Wall Street Journal had an op-ed this week by Donald Boudreaux and Mark Perry claiming that things are great for the middle class.  Here’s why:

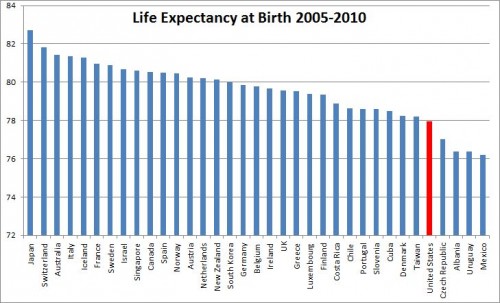
No single measure of well-being is more informative or important than life expectancy. Happily, an American born today can expect to live approximately 79 years — a full five years longer than in 1980 and more than a decade longer than in 1950.

Yes, but.  If life-expectancy is the all-important measure of well-being, then we Americans are less well off than are people in many other countries, including Cuba.

The authors also claim that we’re better off because things are cheaper:

…spending by households on many of modern life’s “basics” — food at home, automobiles, clothing and footwear, household furnishings and equipment, and housing and utilities — fell from 53% of disposable income in 1950 to 44% in 1970 to 32% today.

Globalization probably has much to do with these lower costs.  But when I reread the list of “basics,” I noticed that a couple of items were missing, items less likely to be imported or outsourced, like housing and health care.  So, we’re spending less on food and clothes, but more on health care and houses. Take housing.  The median home values for childless couples increased by 26% between just 1984 and 2001 (inflation-adjusted); for married couples with children, who are competing to get into good school districts, median home value ballooned by 78% (source).

The authors also make the argument that technology reduces the consuming gap between the rich and the middle class.  There’s not much difference between the iPhone that I can buy and the one that Mitt Romney has.  True, but it says only that products filter down through the economic strata just as they always have.  The first ball-point pens cost as much as dinner for two in a fine restaurant.  But if we look forward, not back, we know that tomorrow the wealthy will be playing with some new toy most of us cannot afford. Then, in a few years, prices will come down, everyone will have one, and by that time the wealthy will have moved on to something else for us to envy.

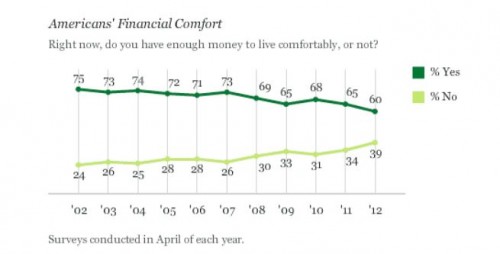
The readers and editors of the Wall Street Journal may find comfort in hearing Boudreaux and Perry’s good news about the middle class.  Middle-class people themselves, however, may be a bit skeptical on being told that they’ve never had it so good (source).

Some of the people in the Gallup sample are not middle class, and they may contribute disproportionately to the pessimistic side.  But Boudreaux and Perry do not specify who they include as middle class.  But it’s the trend in the lines that is important.  Despite the iPhones, airline tickets, laptops and other consumer goods the authors mention, fewer people feel that they have enough money to live comfortably.

Boudreaux and Perry insist that the middle-class stagnation is a myth, though they also say that

The average hourly wage in real dollars has remained largely unchanged from at least 1964—when the Bureau of Labor Statistics (BLS) started reporting it.

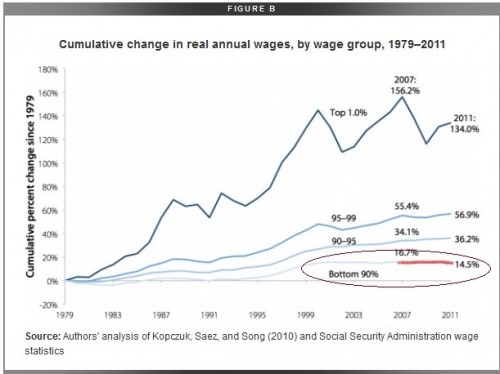
Apparently“largely unchanged” is completely different from “stagnation.”  But, as even the mainstream media have reported, some incomes have changed quite a bit (source).

The top 10% and especially the top 1% have done well in this century.  The 90%, not so much. You don’t have to be too much of a Marxist to think that maybe the Wall Street Journal crowd has some ulterior motive in telling the middle class that all is well and getting better all the time.

—————————

Jay Livingston is the chair of the Sociology Department at Montclair State University.  You can follow him at Montclair SocioBlog or on Twitter.