economics: great recession

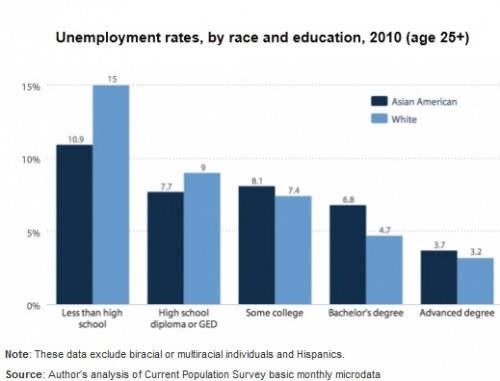
The Economic Policy Institute recently released a report looking at the impacts of the recession and its aftermath on the Asian American population. Due to the model minority stereotype, Asian Americans are often overlooked in discussions of the economic crisis or of poverty and inequality more broadly.  It is true that Asian Americans have generally had lower unemployment rates than other racial/ethnic groups, due to their overall higher educational levels. However, if we look within educational levels beyond a high school diploma, Asian Americans have higher unemployment rates than comparable Whites, with the gap widest for those with bachelor’s degrees:

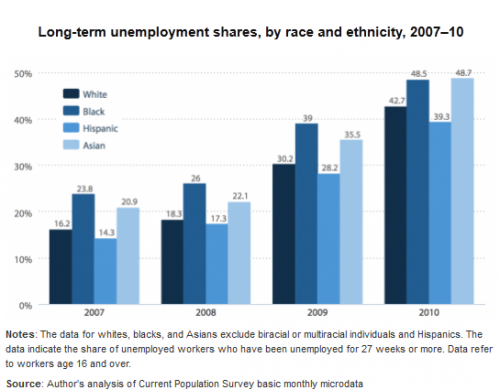
The economic difficulties faced by some Asian Americans is even more noticeable when we look at long-term unemployment (joblessness that lasts 27+ weeks, or more than about half a year). The proportion of the unemployed that fall into this category has risen for every group since 2007, with African-Americans and Asian-Americans more likely than Whites or Hispanics to be unemployed for long periods:

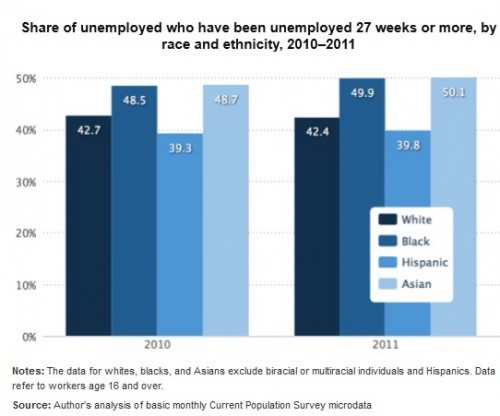
EPI then released an update to the report, incorporating 2011 data. Long-term unemployment has inched upward for every group; half of unemployed African- and Asian-Americans have now been out of work for at least 27 weeks:

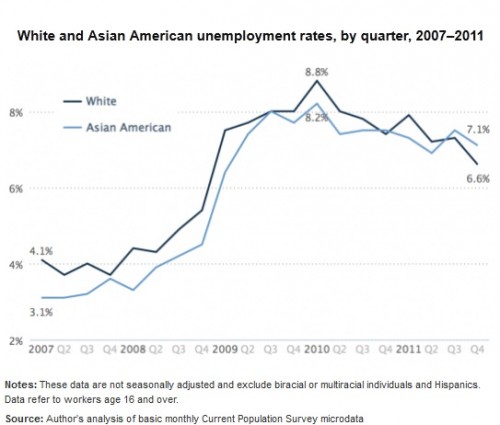
And in fact, despite their higher overall levels of education, Asian Americans now have a higher unemployment rate than Whites (though the rate for both groups is down from the peak in 2010):

For a discussion of factors that may contribute to these patterns among Asian Americans, such as their concentration in states particularly hard-hit by the recession and the proportion of the population that is foreign-born, see the full report.

Cross-posted at Reports from the Economic Front.

Economic recoveries often depend on the state of the housing market.  While an April increase in housing prices has led many analysts to talk of a housing recovery, U.S. home values still remain depressed.  According to a Zillow real estate research report, they are still some 25% below their 2007 peak.

Perhaps the most telling indicator of the state of the housing market is that, as of the first quarter 2012, 31% of all owner-occupied homeowners with a mortgage were “underwater,” which means they had a mortgage greater than the market value of their home. As the table below shows, these homeowners owed, on average, $75,644 more than what their home was worth.

To this point, the high percentage of underwater homeowners represents, in the words of Zillow, only “a potential danger.”  That is because “the majority of underwater homeowners continue to make regular payments on their mortgage, with only 10% percent of the 31% nationwide being delinquent.”  The following figure highlights the percent of delinquent/underwater homeowners in the largest metropolitan areas.

At the same time, as Zillow notes:

With nearly a third of the nation’s mortgaged homeowners in negative equity and the average underwater homeowner having a home value that is 31 percent lower than their mortgage balance, negative equity will prove both to be difficult to fully eradicate near-term and to have pernicious effects longer term as some households continue to encounter short-term financial trouble even with a slowly improving broader economy. Should economic growth slow, more homeowners will not be able to make timely mortgage payments, thereby increasing delinquency rates and eventually foreclosures.

In other words, if the economy slows, or interest rates rise, two very likely possibilities, the housing market could deteriorate quickly, intensifying economic problems.  In short, we are a long way from recovery.

This weekend is commencement at my college, Occidental, and I thought it the perfect day to post new data on the job experiences of recent graduates.  The data, a survey of 444 people in who graduated between 2007 and 2011, comes from a report out of Rutgers.

Just over half of the sample had a full-time job; 12% were un- or underemployed and looking for full-time work.

The recession appears to have depressed earnings by about $3,000. Pre-recession grads were making, on average, $30,000, while post-recession grads took in $27,000:

A third of students (35%) reported that their first job out of college was “not at all related” or “not very closely related” to their major. Almost half saw their first job as temporary and just “to get you by” (though this would drop to 36% when asked about their current job). Only half thought that their first job required a college degree.

A significant proportion of students felt that they’d had to sacrifice something important to secure their job: 27% reported that they were working below their level of education, 24% took a job that paid less than they expected to earn, and 23% were working outside of their interests and training:

Many graduates would have done things differently. Notably a third said they would have re-thought their choice of major:

And most of them would have been more likely to have chosen a professional major (e.g., education or nursing) or one in a “STEM” field (e.g., science, technology, engineering, or math).

Recession-era grads are much more likely to be getting help from their parents, compared to pre-recession grads:

Lisa Wade, PhD is an Associate Professor at Tulane University. She is the author of American Hookup, a book about college sexual culture; a textbook about gender; and a forthcoming introductory text: Terrible Magnificent Sociology. You can follow her on Twitter and Instagram.

The foreclosure crisis that emerged in 2006 continues to displace families and change neighborhoods, creating holes in the social fabric of communities. Kathryn Clark, artist and former urban planner, has created a series of “foreclosure quilts” based on maps of urban areas, with holes representing foreclosed houses.  These unique visual representations call our attention to the holes that remain after foreclosure.

Clark writes on her blog:

The quilt is pieced together using patterns of neighborhood blocks taken from RealtyTrac maps.  Within these, foreclosed lots are shown as holes in the quilts.  The lot locations are completely random and they yield an unexpected beauty when laid out on fabric. These torn holes question the protective nature of a quilt. The situation is so dire that even a quilt can’t provide the security one needs.

Clark’s artistic rendering of these maps points to the size and spread of the foreclosure problem, but also evokes the conflicting experience of home and the reality of the housing market.  Homes, like quilts, promise warmth, comfort and continuity, a connection to family and a sense of protection.  The holes in the quilts powerfully evoke the false promise of security offered by home ownership in the contemporary U.S.

Public policy and real estate market professionals have actively worked to construct home as an owner-occupied, single family house (as opposed to rental, communal space, or other residential option).  The preference for ownership has become so strong that many forgo other forms of investment for a mortgage on a house, and those who rent are told that they are “throwing their money away.”  This normative belief that home ownership is the most desirable option for adults provided justification for consumers to risk their savings, even when offered poor subprime loans, because ownership is symbolically important.

The foreclosure quilts call our attention to the holes that have been produced by the collapse of the housing market.  The focus on neighborhoods and blocks rather than individual houses and families encourages us to think about the impact on communities as well as individuals.  These quilts offer little comfort, and hopefully provoke questions about the sustainability of our singular focus on home ownership.

For images of Clark’s quilts, check out her blog and website or an article on her work at The Atlantic Cities page.

Karen McCormack is an assistant professor of sociology at Wheaton College in Norton, Massachusetts.  She is currently studying the strategies that people employ to manage the risk of losing their homes to foreclosure.

Cross-posted at Reports from the Economic Front.

“Too big to fail” — that was the common explanation voiced at the start of the Great Recession for why the Federal Reserve had no choice but to channel trillions of dollars into the coffers of our leading banks. But, the government also pledged that once the crisis was over it would take steps to make sure we would never face such a situation again.  

The chart below shows the growing concentration of bank assets in the hands of the top 3 U.S. banks. The process really took off starting in the late 1990s and never slowed down right up to the crisis.  It was the reality of the top three banks controlling over 40 percent of total bank assets that gave meaning to the “too big to fail” fears.    

nature09659-f52.jpg

But what has happened since the crisis?  According to Bloomberg Businessweek, the largest banks have only gotten bigger:

Five banks — JPMorgan Chase, Bank of America, Citigroup, Wells Fargo, and Goldman Sachs — held more than $8.5 trillion in assets at the end of 2011, equal to 56 percent of the U.S. economy, according to the Federal Reserve. That’s up from 43 percent five years earlier.

The Big Five today are about twice as large as they were a decade ago relative to the economy, meaning trouble at a major bank would leave the government with the same Hobson’s choice it faced in 2008: let a big bank collapse and perhaps wreck the entire economy or inflame public ire with a costly bailout. “Market participants believe that nothing has changed, that too-big-to-fail is fully intact,” says Gary Stern, former president of the Federal Reserve Bank of Minneapolis.

pol_banks17_inline4051.jpg

Not surprisingly, this kind of economic dominance translates into political power.  For example, the U.S. financial sector is leading the charge for new free trade agreements that promote the deregulation and liberalization of financial sectors throughout the world.  Such agreements will increase their profits but at the cost of economic stability; a trade-off that they apparently find acceptable.

The recently concluded U.S.-Korea Free Trade Agreement is a case in point.  Leading financial firms helped shape the negotiating process.  As a consequence, Citigroup’s Laura Lane, corporate co-chair of the U.S.-Korea FTA Business Coalition, was able to declare that the agreement had “the best financial services chapter negotiated in a free trade agreement to date.”  Among other things, the chapter restricts the ability of governments to limit the size of foreign financial service firms or covered financial activities.  This means that governments would be unable to ensure that financial institutions do not grow “too big to fail” or place limits on speculative activities such as derivative trading.  The chapter also outlaws the use of capital controls.

These same firms are now hard at work shaping the Transpacific Partnership FTA, a new agreement with a similar financial service chapter that includes eight other countries.  Significantly, although the U.S. Trade Representative has refused to share any details on the various chapters being negotiated with either the public or members of Congress, over 600 representatives from U.S. multinational corporations do have access to the texts, allowing them to steer the negotiations in their favor.

The economy may be failing to create jobs but leading financial firms certainly don’t seem to have any reason to complain.

Cross-posted at Reports from the Economic Front.

While the press cheers on every sign of private sector job creation, little attention is being paid to public sector job destruction.  As the Economic Policy Institute reports, while there has been an increase of some 2.8 million private sector jobs since June 2009, public sector employment (federal, state, and local governments combined) has actually fallen by approximately 600,000.  As the figure below reveals, this is a very unusual development .

wwwepiorg.png

According to the Economic Policy Institute, if the percentage growth of public sector employment in this recovery had followed past recovery trends, we would have an additional 1.2 million public sector jobs and some 500,000 additional private sector jobs. A separate reason for concern about this trend is that lost public sector jobs generally means a decline in the services that we need to sustain our communities.  The withering away of our public sector during a period of expansion should worry us all.

A while back I posted about a Pew study looking at long-term unemployment. About a third of those currently out of work have been unemployed for a year or longer.

That makes a recent video released by 60 Minutes Overtime particularly striking. The reporters discuss evidence of discrimination against the long-term unemployed, with employers particularly unwilling to hire those who have been out of a job for two years or more. Given the length and severity of the current recession, this leaves large numbers of jobless people facing the frustrating paradox that you often need a job to get a job, leaving them trapped:

Cross-posted at Reports from the Economic Front.

The Great Recession ended in June 2009, which means we have been in economic expansion for almost 3 years.  Lately the news has been filled with reports of positive economic trends, but how seriously should we take these reports?

One indicator worth looking at is median household income (the red line below).  Unfortunately its trend suggests little reason for cheer. In January 2012, median household income was $50,020.  That was 5.4% lower than it was in June 2009.  Even worse, as the chart below reveals, after a brief uptick it headed back down again.

untitled.jpg

It is true that employment is finally growing, a development reflected in the decline in the unemployment rate (the blue line above).  Unfortunately, this has done little to boost wages.  In fact, real wages actually fell in 2011.  The first chart below highlights the downward turn.  The second chart reveals just how far per capita earnings remain below historical trend.

us-real-wages_thumb.gif

real-wage-and-salary-disbursements-per-capita.jpg

This situation helps to explain why growth has been so anemic.  As the Wall Street Journal wrote:

Many economists in the past few weeks have again reduced their estimates of growth.  The economy by many estimates is on track to grow at an annual rate of less than 2% in the first three months of 2012.  The economy expanded just 1.7% last year.  And since the final months of 2009, when unemployment peaked, the economy has expanded at a pretty paltry 2.5% annual rate.

Without a dramatic change in median household income, growth will remain slow and even the limited employment gains we currently celebrate will likely prove impossible to sustain.  Given the current political climate, it is hard to see how this expansion will be either long lasting or bring meaningful improvements in majority living and working conditions.