class

A new report by the ACLU reveals that “debtors’ prisons” in Ohio.  The phrase refers to the practice of imprisoning someone for the failure to pay fines.  This practice is in violation of the U.S. Constitution. Still, people who can’t afford to pay fines issued in response to traffic violations or misdemeanors are being routinely imprisoned in at least 7 out of 11 counties studied.

1

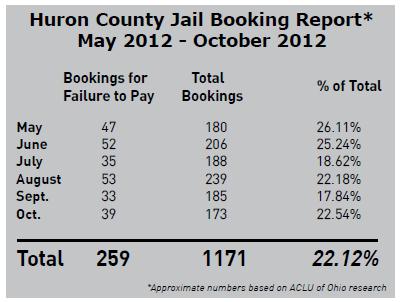
Among the worst offenders is Huron County.  An investigation found that as many as 22% of the bookings in Huron were for failure to pay a fine, usually coded as “contempt.”  Typically this resulted in a 10 day incarceration.  The state would then charge them fees related to being jailed, making it even more unlikely that a person would be able to pay.

The ACLU profiles several individuals.  One is a young man named John with a girlfriend and a nine-month-old daughter.  He was busted for disorderly conduct and underage consumption of alcohol, plus a few other related charges, and fined $1,300.  He agreed to a monthly payment plan to pay off the fines, but wasn’t able to make the payment every month.  Norwalk County, in response, put him in jail for 10 days.

He came out of jail owing more and the cycle continued.  At the time of the interview, John had been incarcerated for a total of 41 days and had incurred an extra $1,599.10 in fees related to his incarceration.  He had paid off $525 of the original $1,300, but owed an additional $2,374.

The ACLU points out that this is obviously an impossible cycle.  A person who is struggling financially may lose their job if they are incarcerated for ten days, especially if it happens more than once.  Meanwhile, loading on additional fines virtually ensures that they won’t be able to pay.  Moreover, however, they point out that it’s not good for Ohio.  The costs debtors incur don’t pay for their incarceration, so the state loses money each time they do this.  The net loss for the state in John’s case, for example, was $3,853.

Lisa Wade, PhD is an Associate Professor at Tulane University. She is the author of American Hookup, a book about college sexual culture; a textbook about gender; and a forthcoming introductory text: Terrible Magnificent Sociology. You can follow her on Twitter and Instagram.

Cross-posted at BlogHer and The Huffington Post.

This PostSecret confession breaks my heart:

1

Most hospitality workers — especially those at high end hotels — routinely interact with people with significantly more economic resources than they.  This is an interesting point of contact analyzed exquisitely by Rachel Sherman in her book, Class Acts: Service and Inequality in Luxury Hotels (review here).

Sherman observes that workers and guests often minimized the class differences between them, even as enacting relationships strongly structured by their relative privilege.  Instead of obsessing about the wealth and privilege of the guests or ranting about the injustice of class inequality, though, they “normalized” it such that it was mostly invisible:

Unequal entitlements and responsibilities were not obscured, because they were perfectly obvious and well-known to interactive workers. Nor were they explicitly legitimated, since workers rarely talked about them as such. Rather, they simply became a feature of the everyday landscape of the hotel. Conflicts over unequal entitlement were couched in individual rather than collective terms and in the language of complaint rather than critique (p. 17).

Interestingly, this confession bucks the trend, which makes me wonder: if normalizing becomes habitual, what upsets it?  What knocks class consciousness back into full view?  In this case, it might have been the personal nature of the question.  When the guest expresses worry about the safety of the worker’s own neighborhood, questioning whether “someone like her” should go “somewhere like that,” perhaps it is to direct of a contrast to ignore.

Also inspired by Class Acts, see Employee “Empowerment” and Corporate Culture.

Lisa Wade, PhD is an Associate Professor at Tulane University. She is the author of American Hookup, a book about college sexual culture; a textbook about gender; and a forthcoming introductory text: Terrible Magnificent Sociology. You can follow her on Twitter and Instagram.

Data presented by Pew Social Trends suggests that immigrants are strongly assimilated by the second generation.  While first-generation immigrants (the children of migrants) often do worse on measures of economic security, second-generation immigrants (their grandchildren) are essentially indistinguishable from the general population.  They’re also more likely to identify as a “typical American.”

1 2

These data should calm the fears of people who think that high fertility rates among immigrants will harm the country by creating a “dependent” underclass or a dangerous population of non-patriots.

Lisa Wade, PhD is an Associate Professor at Tulane University. She is the author of American Hookup, a book about college sexual culture; a textbook about gender; and a forthcoming introductory text: Terrible Magnificent Sociology. You can follow her on Twitter and Instagram.

UBC Sociology student Pat Louie tweeted us a touching set of photographs by artist Gabriele Galimberti.  Each image is a child with his or her favorite toys. They are in Malawi, Italy, Ukraine, Thailand, Zanzibar, Albania, Botswana, and elsewhere and the diversity is stunning.

The photographs reveal a universality — pride in favorite toys and the love of play — but, writes Ben Machell at Galimberti’s website, “how they play can reveal a lot.”  The children’s life experiences influenced their imaginative play:

…the girl from an affluent Mumbai family loves Monopoly, because she likes the idea of building houses and hotels, while the boy from rural Mexico loves trucks, because he sees them rumbling through his village to the nearby sugar plantation every day.

Galimberti, interviewed by Machell, also observed class differences in entitlement to ownership:

The richest children were more possessive. At the beginning, they wouldn’t want me to touch their toys, and I would need more time before they would let me play with them. In poor countries, it was much easier. Even if they only had two or three toys, they didn’t really care. In Africa, the kids would mostly play with their friends outside.

These photographs are reminiscent of another wonderful photography project featuring kids and their toys.  JeonMee Yoon photographed boys with all their blue stuff and girls with all their pink stuff.  The results are striking.  Likewise, there’s a wonderful set of photographs by James Mollison, counterposing portraits with children’s sleeping arrangements across cultures.  These are all wonderful projects that powerfully illustrate global and class difference and inequality.

Lisa Wade, PhD is an Associate Professor at Tulane University. She is the author of American Hookup, a book about college sexual culture; a textbook about gender; and a forthcoming introductory text: Terrible Magnificent Sociology. You can follow her on Twitter and Instagram.

While some austerity advocates really fear (although incorrectly) the consequences of deficit spending, the strongest proponents are actually only concerned with slashing government programs or the use of public employees to provide them.  In other words their aim is to weaken public programs and/or convert them into opportunities for private profit. One measure of their success has been the steady decline in public employment.  Floyd Norris, writing in the New York Times notes:

For jobs, the past four years have been a wash.

The December jobs figures out today indicate that there were 725,000 more jobs in the private sector than at the end of 2008 — and 697,000 fewer government jobs. That works into a private-sector gain of 0.6 percent, and a government sector decline of 3.1 percent.

In total, the number of people with jobs is up by 28,000, or 0.02 percent.

How does that compare? It is by far the largest four-year decline in government employment since the 1944-48 term. That decline was caused by the end of World War II; this one was caused largely by budget limitations.

The chart below, taken from the same post, also reveals just how weak private sector job creation has been over the past 12 years (compare the top three rows — the presidencies of Obama and Bush — w job changes This graphic from the New York Times highlights just how significant the decline in public employment has been in this business cycle compared with past ones.  Each line shows the percentage change in public sector employment for specified months after the start of a recession.  Our recent recession began December 2007 and ended June 2009.   As you can see, what is happening now is far from usual.

1

It is also worth noting that despite claims that most Americans want to see cuts in major federal government programs, the survey data show the opposite.  For example, see the following graphic from Catherine Rampell’s blog post. economix-22pewwhattocut-blog480 As Rampell explains:

In every category except for “aid to world’s needy,” more than half of the respondents wanted either to keep spending levels the same or to increase them. In the “aid to world’s needy” category, less than half wanted to cut spending.

Not surprisingly, this assault on government spending and employment will have real consequences for the economy and job creation. All of this takes us back to the starting point — we are talking policy here.  Whose interests are served by these trends?

Martin Hart-Landsberg is a professor of economics at Lewis and Clark College. You can follow him at Reports from the Economic Front.

Cross-posted at Montclair SocioBlog.

In the Pittsburgh of my youth many decades ago, Rolling Rock was an ordinary, low-priced local beer – like Duquesne (“Duke”) or Iron City. (“Gimme a bottle of Iron,” was what you’d say to the bartender.  And if you were a true Pittsburgher, you pronounced it “Ahrn.”).  The Rolling Rock brewery was in Latrobe, PA, a town about forty miles east whose other claim to fame was Arnold Palmer. The print ads showed the pure sparking mountain stream flowing over rocks.

1

That was then.  In the late 1980s, Rolling Rock started expanding – geographically outward and socially upward.  Typically, when ideas and fashions diffuse through the social class structure they flow downward. Less frequently, the educated classes embrace an artifact of working-class culture. But why?  Their conspicuous consumption (or “signalling,” as we now say) is saying something, but what ideas about themselves and the social landscape are they expressing with their choice of beer?

I had an e-mail exchange about that question with Keith Humphreys, who blogs at The Reality-Based Community.  He too grew up in western Pennsylvania, and we both recalled being surprised years later to see Rolling Rock as a beer of choice among young stock traders and other decidedly non-working-class people.  But we had different ideas as to what these cosmopolitans thought they were doing.  Keith saw it as their way of identifying with the working class.

Those of us who grew up near Latrobe, Pennsylvania are agog when upscale hipsters who could afford something better drink Rolling Rock beer as a sign of their solidarity with us.*

I was more skeptical.  I saw it as the hipsters (or before them, the yuppies) trying to be even more hip – so discerning that they could discover an excellent product in places everyone else had overlooked.  Rolling Rock was a diamond in the rough, a Jackson Pollock for $5 at a yard sale.  The cognoscenti were not identifying with the working-class. They were magnifying the distance.  They were saying in effect, “Those people don’t know what a prize they have.  But I do.”

I had no real data to support that idea, so I asked Gerry Khermouch, who knows more about beverage marketing than do most people.  His Beverage Business Insights puts out industry newsletters, and he writes for Adweek and Brandweek.  He’s also beverage buddies with the guys who changed Rolling Rock marketing.  Here’s what he said,

[F]ar from expressing solidarity with the working class, urban drinkers far afield regarded it as an upscale icon in much the way that Stella Artois has claimed today — a triumph of pure marketing.

One ad campaign in the 90s, “Subtle Differences,” aimed directly at the drinker’s connoisseur fantasies.  Here are two examples:

2

3
It’s the little nuances that make life more interesting. Rolling Rock uses slightly more malt than other domestic golden lagers for a refreshing taste that’s got a little more body, a little more bite. If you’ve noticed, we salute you.

Words like nuance were hardly an appeal to solidarity with the working-class.  Neither was the strategy of raising the price rather than lowering it.

To the marketers, the nuance, the malt, bite, and body didn’t count for much.  Their big investment was in packaging.  Instead of stubby bottles with paper labels, they returned to the long-necked, painted-label bottles with the mysterious “33” on the back. Apparently, the original packaging, the  “Old Latrobe” reference, and the rest added notes of working-class authenticity.

4

As for the actual beer inside those bottles, it may have once been what the ad copy said.  The brewers had tried to overcome the “watery” image from the beer’s early water-over-the-rocks imagery.  But when Anheuser-Busch bought the company in 2006, they closed the Latrobe brewery, and Rolling Rock became a watery, biteless product indistinguishable from the other innocuous lagers that dominate the US market.

* This was an aside in a post about the future of the marijuana market.  See also our post about the resurgence of Pabst Blue Ribbon.

Jay Livingston is the chair of the Sociology Department at Montclair State University. You can follow him at Montclair SocioBlog or on Twitter.

Cross-posted at Reports from the Economic Front.

While newspapers give a lot of ink to arguments about whether reducing the budget deficit will boost or reduce growth, they seem to have little interest in the related issue of whether economic growth really benefits the great majority.

David Cay Johnston, the Pulitzer Prize winning financial journalist, recently addressed this issue drawing on the work of economists Emmanuel Saez and Thomas Piketty:

In 2011 entry into the top 10 percent… required an adjusted gross income of at least $110,651. The top 1 percent started at $366,623.

The top 1 percent enjoyed 81 percent of all the increased income since 2009. Just over half of the gains went to the top one-tenth of 1 percent, and 39 percent of the gains went to the top 1 percent of the top 1 percent.

Ponder that last fact for a moment — the top 1 percent of the top 1 percent, those making at least $7.97 million in 2011, enjoyed 39 percent of all the income gains in America.

So, 81 percent of all the new income generated from 2009 to 2011 was captured by the top 1 percent income earners, where income is defined as adjusted gross income, which refers to income minus deductions or taxable income.  In other words, growth, even accelerated growth, is not going to do the majority much good if the economic structure remains the same.

Johnston highlights the problem with our existing economic model with perhaps an even more shocking example.  He compares the average income growth of the bottom 90 percent with the average income growth of the top 10 percent, 1 percent, and top 1 percent of the top 1 percent over the period 1966 to 2011.

It turns out that the average income of the bottom 90 percent rose by a miniscule $59 over the period (as measured in 2011 dollars).  By comparison, the average income of the top 10 percent rose by $116,071, the average income of the top 1 percent rose by $628,817, and the average income of the top 1 percent of the top 1 percent increased by a whopping $18,362,740.  In short, growth alone means little if the great majority of people are structurally excluded from the benefits.

In an effort to highlight this extreme disparity in adjusted income growth rates, Johnston suggests plotting the numbers on a chart, with $59, the amount gained by the bottom 90 percent, represented by a bar one inch high.  As the chart below shows, the bar representing average gains for the top 10 percent would be 163 feet high, that for the top 1 percent would be 884 feet high, and that for the top 1 percent of the top 1 percent would be 4.9 miles high.

1

In sum, the real challenge facing the great majority of Americans is not figuring out how to make the economy growth faster.  Rather, it is figuring out how to create space for a real debate about how to transform our economy so that growth will actually satisfy majority needs.

Martin Hart-Landsberg is a professor of economics at Lewis and Clark College. You can follow him at Reports from the Economic Front.

Last week many media outlets were busy celebrating the Dow Jones record high, suggesting that it was indicative of the United States’ recovery from the greatest economic downturn since The Great Depression.  The graph below comes from a New York Times story with the headline “As Fears Recede, Dow Industrial Hits a Milestone.”

However, another story buried in the Business section of the New York Times, titled “Recovery in U.S. Is Lifting Profits, but Not Adding Jobs,” contains a graph illustrating how the supposed economic recovery is bitter-sweet at best:

2

The second graph uses data from the Bureau of Economic Analysis to highlight the fact that corporate profits and stock prices are at record highs, but the share of profits workers have taken home has steadily dropped since the early 1980s.  Some of the steepest declines have come during the last few years, or during the supposed “recovery.”

These two graphs illustrate that while ”The Market” is probably considered the go-to indicator of economic well-being, stock indexes are not always indicative of the economic reality experienced by non-investors.  If businesses and corporations were increasing their stock value by investing to expand productivity, thereby creating good-paying jobs and opportunities for workers, rising markets would be a sign good of economic times for all.  But this data suggests that is not what is happening; instead, as the twin charts show, rising corporate profits are at least partly the result of wage suppression.

Jason Eastman is an Assistant Professor of Sociology at Coastal Carolina University who researches how culture and identity influence social inequalities.