class

For the last week of December, we’re re-posting some of our favorite posts from 2012. Cross-posted at Pacific Standard and Global Policy TV.

The United States is unusual among developed countries in guaranteeing exactly zero weeks of paid time-off from work upon the birth or adoption of a child. Japan offers 14 weeks of paid job-protected leave, the U.K. offers 18, Denmark 28, Norway 52, and Sweden offers 68 (yes, that’s over a year of paid time-off to take care of a new child).

The U.S. does guarantee that new parents receive 12 weeks of non-paid leave, but only for parents who work in companies that employ 50 workers or more and who have worked there at least 12 months and accrued 1,250 hours or more in that time.  These rules translate to about 1/2 of women.  The other half are guaranteed nothing.

Companies, of course, can offer more lucrative benefits if they choose to, so some parents do get paid leave.  This makes the affordability of having children and the pleasure and ease with which one can do so a class privilege.  A new report by the U.S. Census Bureau documents this class inequality, using education as a measure.  If you look at the latest data on the far right (2006-2008), you’ll see that the chances of receiving paid leave is strongly correlated with level of education:

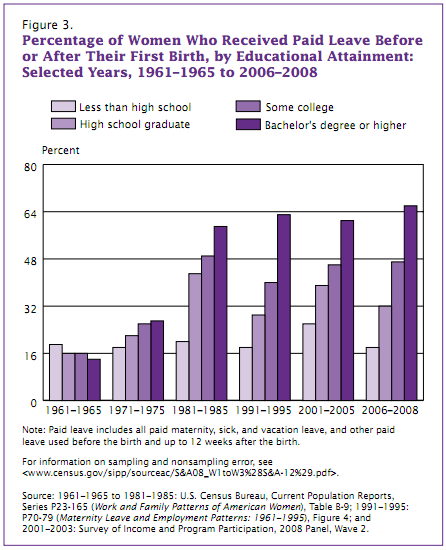
Looking across the entire graph, however, also reveals that this class inequality only emerged in the early 1970s and has been widening ever since.  This is another piece of data revealing the way that the gap between the rich and the poor has been widening.

Just to emphasize how perverse this is:

  • People with more education, who on average have higher incomes, are often able to take paid time off; but less-economically advantaged parents are more likely to have to take that time unpaid.  During the post-birth period, then, the economic gap widens.

There’s more:

  • Many less-advantaged parents can’t afford to take time off un-paid, so they keep working.  But even this widens the gap because their salary is lower than the salary the richer person continues to receive during their paid time off of work.  So the rich get paid more for staying home than the poor get for going to work.

We often use the minimizing word  “just” when  describing what stay-at-home parents do.  “What are you doing these days?” asks an old friend at a class reunion.  “Oh, just staying home and taking care of my kids,” a parent might say, as if raising kids is “doing nothing.”  We trivialize what parents do.  But, in fact, raising children is a valuable contribution to the nation.  We need a next generation to keep moving forward as a country.  Unfortunately the U.S. continues to treat having kids like a hobby (something its citizens choose to do for fun, and should pay for themselves).  Without state support for early parenting, being present in those precious early months is a class-based privilege, one that ultimately exacerbates the very class disadvantage that creates unequal access to the luxury of parenting in the first place.

Lisa Wade, PhD is an Associate Professor at Tulane University. She is the author of American Hookup, a book about college sexual culture; a textbook about gender; and a forthcoming introductory text: Terrible Magnificent Sociology. You can follow her on Twitter and Instagram.

Cross-posted at Reports from the Economic Front.

The stock market looms large in our understanding of the economy.  The business news is often little more than a report on the movement of the market.  High school economics classes often introduce the study of the economy to students by encouraging them to pick and follow a favorite stock.  Managers of corporations are judged by how well their actions result in higher stock prices.

All this could easily lead one to think that the great majority of Americans are stockholders.  In fact, as the chart below shows, very few Americans own significant shares of stock and therefore directly benefit from the market’s rise.

It is easy to understand why the top earners are happy with this identification of the economy with the stock market.  It ensures that economic activity is largely organized and outcomes evaluated with their interests in mind.  What is not so easy to understand is why the great majority of working people continue to accept this identification.

Martin Hart-Landsberg is a professor of economics at Lewis and Clark College. You can follow him at Reports from the Economic Front.

Cross-posted at CNN.

For the past few days, Americans have been weeping together and wringing our hands once again at the senseless tragedy of a mass murder inside a school. The horrific scene in Newtown, Connecticut, is now seared permanently in our collective conscience, as we search for answers. We’ll look at the photograph of Adam Lanza and ask over and over again how he could have come to such a deadly crossroads.

We still know nothing about his motives, only the devastating carnage he wrought. And yet we’ve already heard from experts who talk about mental illness, Asperger’s syndrome, depression, and autism. The chorus of gun boosters has defensively chimed in about how gun control would not have prevented this.

Former Arkansas Gov. Mike Huckabee offered the theory that since “we have systematically removed God from our schools, should we be so surprised that schools would become a place of carnage?” (As if those heathen children deserved it?)

All the while, we continue to miss other crucial variables — even though they are staring right back at us when we look at that photograph. Adam Lanza was a middle class white guy.

If the shooter were black and the school urban, we’d hear about the culture of poverty; about how inner-city life breeds crime and violence; perhaps even some theories about a purported tendency among blacks towards violence.

As we’ve seen in the past week, it’s not only those living on the fringes of society who express anger through gun violence.

Yet the obvious fact that Lanza — and nearly all the recent mass murderers who targeted non-work settings — were middle class white boys seems to barely register. Look again at the pictures of Jared Lee Loughner (Tucson), James Eagan Holmes (Aurora) and Wade Michael Page (Oak Creek) — a few of the mass killers of the past couple of years. (Yes, the case of Seung-Hui Cho, the perpetrator at Virginia Tech, the worst school shooting in our history, stands out as the exception. And worth discussing.)

Why are angry young men setting out to kill entire crowds of strangers?

Motivations are hard to pin down, but gender is the single most obvious and intractable variable when it comes to violence in America. Men and boys are responsible for 95% of all violent crimes in this country. “Male criminal participation in serious crimes at any age greatly exceeds that of females, regardless of source of data, crime type, level of involvement, or measure of participation” is how the National Academy of Sciences summed up the extant research.

How does masculinity figure into this? From an early age, boys learn that violence is not only an acceptable form of conflict resolution, but one that is admired. However the belief that violence is an inherently male characteristic is a fallacy. Most boys don’t carry weapons, and almost all don’t kill: are they not boys? Boys learn it.

They learn it from their fathers. They learn it from a media that glorifies it, from sports heroes who commit felonies and get big contracts, from a culture saturated in images of heroic and redemptive violence. They learn it from each other.

In talking to more than 400 young men for my book, Guyland: The Perilous World Where Boys Become Men, I heard over and over again what they learn about violence. They learn that if they are crossed, they have the manly obligation to fight back. They learn that they are entitled to feel like a real man, and that they have the right to annihilate anyone who challenges that sense of entitlement.

This sense of entitlement is part of the package deal of American manhood — the culture that doesn’t start the fight, as Margaret Mead pointed out in her analysis of American military history, but retaliates far out of proportion to the initial grievance. They learn that “aggrieved entitlement” is a legitimate justification for violent explosion.

The easy availability of guns is another crucial variable. After the terrible school shooting in Dunblane, Scotland, in 1996, Great Britain enacted several laws that effectively made owning handguns illegal in that country. The murder rate in the U.S. is more than three times higher than Britain.

And yes, boys have resorted to violence for a long time, but sticks and fists and even the occasional switchblade do not create the bloodbaths of the past few years. In 2011, more than 80% of all homicides among boys aged 15 to 19 were firearm related.

We need a conversation about gun control laws. And far more sweeping — and necessary — is a national meditation on how our ideals of manhood became so entangled with violence.

It’s also worth discussing why so many of these young mass murderers are white. Surely boys of color have that same need to prove their masculinity, and a similar sense of entitlement to annihilate those who threaten it. Perhaps the only difference is that it seems to be nearly the exclusive province of white boys to so dramatically expand the range of their revenge and seek to destroy the entire world, not simply the person or group that committed the supposed offense. Perhaps. It’s a conversation worth having.

I am not for a moment suggesting we substitute race or gender for the other proximate causes of this tragedy: lax gun laws, mental illness. I am arguing only that we can never fully understand it, unless we also add these elements to our equation. Without them, the story is entirely about him, the shooter. But the bigger story is also about us.

In the coming weeks, we’ll learn more about Adam Lanza, his motives, his particular madness. We’ll hear how he “snapped” or that he was seriously mentally ill. We’ll try to explain it by setting him apart, by distancing him from the rest of us.

And we’ll continue to miss the point. Not only are those children at Sandy Hook Elementary School our children. Adam Lanza is our child also. Of course, he was mad — as were Eric Harris and Dylan Klebold, and Seung-Hui Cho, Jared Lee Loughner, James Eagan Holmes, and Wade Michael Page — and the ever-longer list of boys and young men who have exploded in a paroxysm of vengeful violence in recent years. In a sense, they weren’t deviants, but over-conformists to norms of masculinity that prescribe violence as a solution. Like real men, they didn’t just get mad, they got even. Until we transform that definition of manhood, this terrible equation of masculinity and violence will continue to produce such horrific sums.

————————

Michael Kimmel is a professor of sociology at the State University of New York at Stonybrook.  He has written or edited over twenty volumes, including Manhood in America: A Cultural History and Guyland: The Perilous World Where Boys Become Men.  You can visit his website here.

Cross-posted at The Huffington Post.In most densely-packed urban cities, one will be able to observe a disturbing phenomenon: wealthy people marching past the homeless, day in and day out.  Often, the residents of the street and the residents of the apartments recognize each other and even know each other’s routines.  And, yet, familiarity doesn’t breed concern.

Psychologists Lasana Harris and Susan Fiske were able to detect a neurological process behind the ability to get used to seeing others suffer. Using functional MRIs, they exposed individuals to images of the homeless.  These images tended to activate parts of the brain associated with disgust.  This, they argue, supports the idea that “extreme out-groups may be perceived as less than human…”  It is easy to overlook the suffering of the homeless, then, because we dehumanize them.

In an effort to disrupt this cognitive process, documentary film maker Goro Toshima has released a new film, Broken Doors.  The 36-minute documentary follows a young homeless couple in Los Angeles, Starr and Rico.  Not only does it put faces and names to an otherwise reviled and ignored population, the documentary shows viewers just how difficult it can be to survive on the streets and to get off.

Lisa Wade, PhD is an Associate Professor at Tulane University. She is the author of American Hookup, a book about college sexual culture; a textbook about gender; and a forthcoming introductory text: Terrible Magnificent Sociology. You can follow her on Twitter and Instagram.

Over at The Global Sociology Blog, SocProf put up some interesting visuals about social mobility, the likelihood that you have a significantly different economic status than your father.  Social mobility is important because it measures the degree to which a society has a caste system (in which you are restricted to the class you are born into, by whatever means) or one that gives people equal opportunities to ascend or descend the class hierarchy according to their hard work and talent.

Compared to similar countries, the U.S. has low social mobility (though most Americans think the opposite), along with Italy, the U.K., Chile, and Slovenia .  Scandinavian countries, Canada, and Australia have the most (see SocProf’s data here).

SocProf, however, asked a question I’ve never seen asked before: does this mobility differ by gender?  It does.  She found that daughters are more upwardly mobile than sons.

This first graph shows the percent of sons, born to a low-earning father, who will end up the top 40% of earners (orange) or the bottom 40% (blue).  Social mobility in the U.S. is lowest among the countries featured; almost 70% of American sons of low-earners stay in the bottom 40%.

The second graph is the same data for daughters.  Mobility for daughters is higher in all countries, but it is especially so in the U.S.  While 70% of sons stay in the bottom 40%, we can say the same for less than half of daughters.

Reflecting on the fact that the difference between daughters and sons was higher in the U.S. than in the comparison countries, SocProf suggests that “[g]reater mobility seems to go together with greater gender equality” in mobility.

See also this interactive graph mapping social mobility where you can see how you compare to the rest of the U.S.

Lisa Wade, PhD is an Associate Professor at Tulane University. She is the author of American Hookup, a book about college sexual culture; a textbook about gender; and a forthcoming introductory text: Terrible Magnificent Sociology. You can follow her on Twitter and Instagram.

The following two charts taken from a Center for Economic Policy and Research Center study by John Schmitt and Janelle Jones highlight the distressed nature of the U.S. labor market and the need for raising the minimum wage and strengthening union organizing.

Schmitt and Jones define low wage work as that work paying $10.00 an hour or less in 2011 dollars.  As the charts show, low wage workers are far more educated and older in 2011 than in 1979.


Education and experience are not sufficient to ensure a living wage.

Not surprisingly, growing numbers of low wage workers at Walmart and at chain fast food restaurants have begun engaging in direct action for higher wages and better working conditions.   They deserve our support.

—————————

Martin Hart-Landsberg is a professor of Economics and Director of the Political Economy Program at Lewis and Clark College.  You can follow him at Reports from the Economic Front.

Cross-posted at Reports from the Economic Front.

With the election over, the news is now focused, somewhat hysterically, on the threat of the fiscal cliff.

The fiscal cliff refers to the fact that at the end of this calendar year several temporary tax cuts are scheduled to expire (including those that lowered rates on income and capital gains as well as payroll taxes) and early in the next year spending cuts are scheduled for military and non-military federal programs.  See here for details on the taxes and programs.

Most analysts agree that if tax rates rise and federal spending is cut the result will be a significant contraction in aggregate demand, pushing the U.S. economy into recession in 2013.

The U.S. economy is already losing steam.  GDP growth in the second half of 2009, which marked the start of the recovery, averaged 2.7% on an annualized basis.  GDP growth in 2010 was a lower 2.4%.  GDP growth in 2011 averaged a still lower 2.0%.  And growth in the first half of this year declined again, to an annualized rate of 1.8%.

With banks unwilling to loan, businesses unwilling to invest or hire, and government spending already on the decline, there can be little doubt that a further fiscal tightening will indeed mean recession.

So, assuming we don’t want to go over the fiscal cliff, what are our choices?

Both Republicans and Democrats face this moment in agreement that our national deficits and debt are out of control and must be reduced regardless of the consequences for overall economic activity.  What they disagree on is how best to achieve the reduction.  Most Republicans argue that we should renew the existing tax cuts and protect the military budget.  Deficit reduction should come from slashing the non-military discretionary portion of the budget, which, as Ethan Pollack explains, includes:

…safety net programs like housing vouchers and nutrition assistance for women and infants; most of the funding for the enforcement of consumer protection, environmental protection, and financial regulation; and practically all of the federal government’s civilian public investments, such as infrastructure, education, training, and research and development.

The table below shows the various programs/budgets that make up the non-security discretionary budget and their relative size.  The chart that follows shows how spending on this part of the budget is already under attack by both Democrats and Republicans.

Unfortunately, the Democrat’s response to the fiscal cliff is only marginally better than that of the Republicans.  President Obama also wants to shrink the deficit and national debt, but in “a more balanced way.”  He wants both tax increases and spending cuts.  He is on record seeking $4 trillion in deficit reduction over a ten year period, with a ratio of $2.50 in spending cuts for every $1 in new revenue.

The additional revenue in his plan will come from allowing tax cuts for the wealthy to expire, raising the tax rate on the top income tax bracket, and limiting the value of tax deductions.  While an important improvement, President Obama is also committed to significant cuts in non-military discretionary spending.  Although his cuts would not be as great as those advocated by the Republicans, reducing spending on most of the targeted programs makes little social or economic sense given current economic conditions.

So, how do we scale the fiscal cliff in a responsible way?

We need to start with the understanding that we do not face a serious national deficit or debt problem.  As Jamie Galbraith notes:

…is there a looming crisis of debt or deficits, such that sacrifices in general are necessary? No, there is not. Not in the short run — as almost everyone agrees. But also: not in the long run. What we have are computer projections, based on arbitrary — and in fact capricious — assumptions. But even the computer projections no longer show much of a crisis. CBO has adjusted its interest rate forecast, and even under its “alternative fiscal scenario” the debt/GDP ratio now stabilizes after a few years.

Actually, as the chart below shows, the deficit is already rapidly falling.  In fact, the decline in government spending over the last few years is likely one of the reasons why our economic growth is slowing so dramatically.

As Jed Graham points out:

From fiscal 2009 to fiscal 2012, the deficit shrank 3.1 percentage points, from 10.1% to 7.0% of GDP.  That’s just a bit faster than the 3.0 percentage point deficit improvement from 1995 to ’98, but at that point, the economy had everything going for it.

Other occasions when the federal deficit contracted by much more than 1 percentage point a year have coincided with recession. Some examples include 1937, 1960 and 1969.

In short, we do not face a serious problem of growing government deficits.  Rather the problem is one of too fast a reduction in the deficit in light of our slowing economy.

As to the challenge of the fiscal cliff — here we have to recognize, as Josh Bivens and Andrew Fieldhouse explain, that:

…the budget impact and the economic impact are not necessarily the same. Some policies that are expensive in budgetary terms have only modest economic impacts (for example, the 2001 and 2003 tax cuts aimed at high-income households are costly but do not have much economic impact). Conversely, other policies with small budgetary costs have big economic impacts (for example, extended unemployment insurance benefits).

In other words, we should indeed allow the temporary tax rate deductions for the wealthy to expire, on both income and capital gains taxes.  These deductions cost us dearly on the budget side without adding much on the economic side.  As shown here and here, the evidence is strong that the only thing produced by lowering taxes on the wealthy is greater income inequality.

Letting existing tax rates rise for individuals making over $200,000 and families making over $250,000 a year, raising the top income tax bracket for both couples and singles that make more than $388,350, and limiting tax deductions will generate close to $1.5 trillion dollars over ten years as highlighted below in a Wall Street Journal graphic .

However, in contrast to President Obama’s proposal, we should also support the planned $500 billion in cuts to the military budget.  We don’t need the new weapons and studies are clear that spending on the military (as well as tax cuts) is a poor way to generate jobs.  For example, the table below shows the employment effects of spending $1 billion on the military versus spending the same amount on education, health care, clean energy, or tax cuts.

defense.jpg

And, we should also oppose any cuts in our non-security discretionary budget. Instead, we should take at least half the savings from the higher tax revenues and military spending cuts — that would be a minimum of $1 trillion — and spend it on programs designed to boost our physical and social infrastructure.  Here I have in mind retrofitting buildings, improving our mass transit systems, increasing our development and use of safe and renewable energy sources like wind and solar, and expanding and strengthening our social services, including education, health care, libraries, and the like.

Our goal should be a strong and accountable public sector, good jobs for all, and healthy communities, not debt reduction.  The above policy begins to move us in the right direction.

—————————

Martin Hart-Landsberg is a professor of Economics and Director of the Political Economy Program at Lewis and Clark College.  You can follow him at Reports from the Economic Front.

This month the Census Bureau released a supplemental poverty report to provide a broader picture of the poor in the U.S. The official poverty rate is based on a measure developed in the early 1960s. Researchers at the time determined that families spent about 1/3 of their income on food, so they calculated the lowest possible cost of a minimally nutritionally sufficient diet for a particular family size, multiplied it by 3, and the resulting number determined who was defined as poor. The amount has been adjusted for inflation but otherwise the measure is the same.

Critics argue this definition may no longer make sense. Since the 1960s, food has generally gotten cheaper while housing has become a much bigger portion of many families’ budgets. The measure doesn’t account for the different costs of living (especially for housing) in different parts of the U.S. It also doesn’t take government benefits a family might be receiving into account.

The supplemental measure is meant to address some of these problems; it will be released each year along with the standard poverty measure. It attempts to determine how much is needed to cover housing, food, clothing, utilities, and a bit for other needs (transportation, personal care items, etc.), while taking public assistance benefits into account.

The supplemental poverty measure (SPM) showed a somewhat higher poverty rate overall (16.1% vs. 15% with the official poverty rate). Because it takes benefits such as daycare subsidies, nutritional assistance programs, etc., into account, the SPM actually showed a lower poverty rate for children under 18 than the official rate does. However, adults were more likely to be defined as poor with the SPM. This is especially true for older adults. For those over 65, 8.7% are officially poor, but with the SPM, it’s 15.1%:

Dylan Matthews, at the Washington Post, created a graph to show the impact of some important expenses and government assistance programs on poverty, since the SPM takes benefits, and a greater range of expenses, into account in its measure. The graph shows how much each program/expense reduced the adjusted poverty rate, based on data presented in the report.

Social Security has the single biggest impact; it reduced the SPM by 8 percentage points. That is, if they had not included Social Security benefits in the measure, the SPM poverty rate would have been 24.1%, not 16.1%. On the other hand, taking Temporary Aid to Needy Families (TANF), the cash assistance program created in the welfare reform process in the 1990s, into account did little to affect the calculated poverty rate, indicating it does little to alleviate poverty (intentionally so, many would argue). Note the axis is percentage points, not percent:

At the bottom of the graph we see several items that increased the supplemental poverty rate: looking at how much income tax people paid (countering the myth that low-income people don’t pay income taxes), payroll axes, expenses related to work, and medical expenses, with out-of-pocket medical expenses being the largest factor.

There’s tons of data in the tables that show which groups would be more or less likely to be defined as poor in the official and supplemental poverty rates. Check out the full report.

Gwen Sharp is an associate professor of sociology at Nevada State College. You can follow her on Twitter at @gwensharpnv.