class

According to a June 2014 Russell Sage Foundation report, the average U.S. household experienced a real wealth decline of more than one-third over the 10 years ending in 2013.

Table 1 shows that the net worth of the median household fell from $87,992 in 2003 to $56,335 in 2013, for a decline of 36%.  In fact, the last ten years were hard on the overwhelming majority of American households.  Only the top 2 groups enjoyed wealth gains over the period.  Also noteworthy is the tiny net worth of households below the median.

1

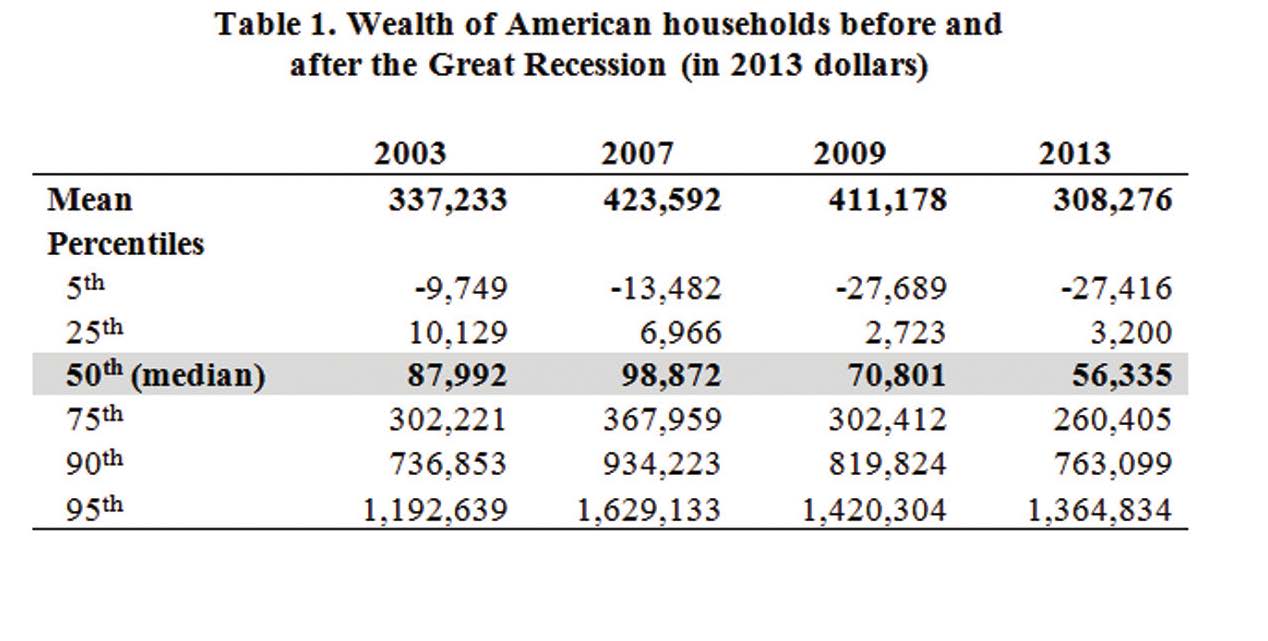
Figure 1 provides a longer term perspective on wealth movements.  We can see that most households enjoyed growing wealth from 1984 to the 2007 crisis, with wealth falling across the board since.  However, the median household is now significantly poorer than it was in 1984.  Only the richer households managed to maintain most of their earlier gains in wealth.

2

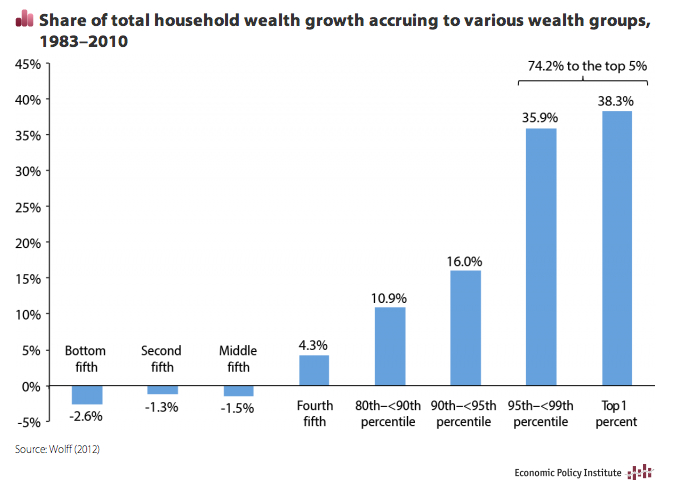
These trends highlight the fact that we have a growing inequality of wealth, as well as of income, and they are not likely to reverse on their own.

Martin Hart-Landsberg is a professor of economics at Lewis and Clark College. You can follow him at Reports from the Economic Front.

There is one similarity between the Israel/Gaza crisis and the U.S. unaccompanied child immigrant crisis: National borders enforcing social inequality. When unequal populations are separated, the disparity creates social pressure at the border. The stronger the pressure, the greater the military force needed to maintain the separation.

To get a conservative estimate of the pressure at the Israel/Gaza border, I compared some numbers for Israel versus Gaza and the West Bank combined, from the World Bank (here’s a recent rundown of living conditions in Gaza specifically). I call that conservative because things are worse in Gaza than in the West Bank.

Then, just as demographic wishful thinking, I calculated what the single-state solution would look like on the day you opened the borders between Israel, the West Bank, and Gaza. I added country percentiles showing how each state ranks on the world scale (click to enlarge).

1

Israel’s per capita income is 6.2-times greater, its life expectancy is 6 years longer, its fertility rate is a quarter lower, and its age structure is reversed. Together, the Palestinian territories have a little more than half the Israeli population (living on less than 30% of the land). That means that combining them all into one country would move both populations’ averages a lot. For example, the new country would be substantially poorer (29% poorer) and younger than Israel, while increasing the national income of Palestinians by 444%. Israelis would fall from the 17th percentile worldwide in income, and the Palestinians would rise from the 69th, to meet at the 25th percentile.

Clearly, the separation keeps poor people away from rich people. Whether it increases or decreases conflict is a matter of debate.

Meanwhile

Meanwhile, the USA has its own enforced exclusion of poor people.

3
Photo of US/Tijuana border by Kordian from Flickr Creative Commons.

The current crisis at the southern border of the USA mostly involves children from Guatemala, Honduras, and El Salvador. They don’t actually share a border with the USA, of course, but their region does, and crossing into Mexico seems pretty easy, so it’s the same idea.

To make a parallel comparison to Israel and the West Bank/Gaza, I just used Guatemala, which is larger by population than Honduras and El Salvador combined, and also closest to the USA. The economic gap between the USA and Guatemala is even larger than the Israeli/Palestinian gap. However, because the USA is 21-times larger than Guatemala by population, we could easily absorb the entire Guatemalan population without much damaging our national averages. Per capita income in the USA, for example, would fall only 4%, while rising more than 7-times for Guatemala (click to enlarge):

4

This simplistic analysis yields a straightforward hypothesis: violence and military force at national borders rises as the income disparity across the border increases. Maybe someone has already tested that.

The demographic solution is obvious: open the borders, release the pressure, and devote resources to improving quality of life and social harmony instead of enforcing inequality. You’re welcome!

Cross-posted at Family Inequality.

Philip N. Cohen is a professor of sociology at the University of Maryland, College Park, and writes the blog Family Inequality. You can follow him on Twitter or Facebook.

Everyone!

Well, almost.

Andrew Cherlin and his colleagues report that 64% of women and 63% of men have had at least one child out of wedlock.  The dominance of non-marital births is true for everyone, except people with four-year college degrees.

Cherlin’s charts each present the same data — births by age and relationship status — for women who didn’t finish high school (figure one), high school grads (figure two), women with some college (and so on), and women with a bachelors (etc).  There’s some differences between the first three graphs, but the big leap comes with the last.

Didn’t finish high school:

1.jpg

High school grads:1 Some college:2 College grads:3

“There are two clear paths through adulthood,” Cherlin told The Altantic, “one for people who have a bachelor’s degree and one for people who don’t.”

Thanks for the link @theologybird!

Lisa Wade, PhD is an Associate Professor at Tulane University. She is the author of American Hookup, a book about college sexual culture; a textbook about gender; and a forthcoming introductory text: Terrible Magnificent Sociology. You can follow her on Twitter and Instagram.

Last week CNN triumphantly reported that the job market has recovered to its 2008 peak.  Here’s the headline:

1

Not so fast, though.

Sociologist Philip Cohen observes that the real news is hidden in the fourth paragraph. There the author of the piece acknowledges that the job data are numbers, not proportions.  The numbers have bounced back but, because of the addition of almost 12 million people to the U.S. population, the percent of Americans who have jobs or are in school remains lower than it was in 2008.

From CNN:

Given population growth over the last four years, the economy still needs more jobs to truly return to a healthy place. How many more? A whopping 7 million, calculates Heidi Shierholz, an economist with the Economic Policy Institute.

Using the Bureau of Labor Statistics, Cohen offers us a clearer look at where we’re at:

1a

Lisa Wade, PhD is an Associate Professor at Tulane University. She is the author of American Hookup, a book about college sexual culture; a textbook about gender; and a forthcoming introductory text: Terrible Magnificent Sociology. You can follow her on Twitter and Instagram.

The Nation sparked a robust discussion last week with its incisive online conversation, Does Feminism Have a Class Problem? The panelists addressed the “Lean In” phenomenon, articulating how and why Sheryl Sandberg’s focus on self-improvement – rather than structural barriers and collective action to overcome them – angered quite a few feminists on the left.

While women of different economic backgrounds face many different realities, they also share similar work-life balance struggles. In that vein, the discussants argue that expanding family-friendly workplace policies – which would improve the lives of working women up and down the economic ladder – could help bridge the feminist class divide.

A growing body of research indicates that there are few other interventions that improve the economic prospects and work-life balance of women workers as much as unions do. A new report from the Center for Economic and Policy Research (CEPR), which I co-authored with my colleagues Janelle Jones and John Schmitt, shows just how much of a boost unions give to working women’s pay, benefits and workplace flexibility.Photo Credit:Minnesota Historical Society

For example, all else being equal, women in unions earn an average of 13 percent – that’s about $2.50 per hour – more than their non-union counterparts. In other words, unionization can raise a woman’s pay as much as a full year of college does. Unions also help move us closer to equal pay: a study by the National Women’s Law Center determined that the gender pay gap for union workers is only half of what it is for those not in unions.

Unionized careers tend to come with better health and retirement benefits, too. CEPR finds that women in unions are 36 percent more likely to have health insurance through their jobs – and a whopping 53 percent more likely to participate in an employer-sponsored retirement plan.

Unions also support working women at those crucial times when they need time off to care for themselves or their families. Union workplaces are 16 percent more likely to allow medical leave and 21 percent more likely to offer paid sick leave. Companies with unionized employees are also 22 percent more likely to allow parental leave, 12 percent more likely to offer pregnancy leave, and 19 percent more likely to let their workers take time off to care for sick family members.

Women make up almost half of the union workforce and are on track to be in the majority by 2025. As women are overrepresented in the low-wage jobs that are being created in this precarious economy – they are 56.4% of low-wage workers and over half of fast food workers – unions are leading and supporting many of the campaigns to improve their situations. In an important sense, the union movement already is a women’s movement.

Education and skills can get women only so far. It’s a conundrum that women have surpassed men when it comes to formal schooling, yet women have made little progress catching up on pay. Many women who do everything right — getting more education and skills — still find themselves with low wages and no benefits.

With unions already playing a central role in helping to meet the needs working women and their families in the 21st century economy, anyone concerned about the well-being of women should also care about unions.

Nicole Woo is the director of domestic policy at the Center for Economic and Policy Research.  This post is based on her new study,  “Women, Working Families, and Unions,” and originally appeared at Girl w/ Pen!

Mean and median are two measures of “average.”  The mean is the average as we typically think of it: the sum of things divided by the total number of things.  The median, in contrast, is literally the number in the middle if we align all the quantities in order.  People often use median instead of mean because it is insensitive to extreme outliers which may skew the mean in one direction or another.

For a quick illustration of the difference, I often use the example of income. I choose a plausible average (mean) for the classroom population and review the math. “If Bill Gates walks into the room,” I say, “the average income is now in the billions. The median hasn’t moved, but the mean has gone way up.” So has the Gini coefficient.

Here’s a more realistic and global illustration – the net worth of people in the wealthier countries.  The U.S. ranks fourth in mean worth – $301,000 per person…

1 (2) - Copy

…but the median is far lower – $45,000, 19th out of the twenty nations shown.  (The graph is from Credit Suisse via CNN.)

The U.S. is a wealthy nation compared with others, but  “average” Americans, in the way that term is generally understood, are poorer than their counterparts in other countries. 

Jay Livingston is the chair of the Sociology Department at Montclair State University. You can follow him at Montclair SocioBlog or on Twitter.

I’d hope that someone who has written a book about “What Shapes Our Fortunes” would have had Sociology 101 where he would have learned the fundamentally different ways that income and wealth work in our economy.  But apparently not.

In Rags to Riches to Rags Again,  Mark Rank writes that because of a great deal of turbulence in household earning over a lifetime “we have much more in common with one another than we dare to realize.”

One of the reasons for such fluidity at the top is that, over sufficiently long periods of time, most American households go through a wide range of economic experiences, both positive and negative. Individuals we interviewed spoke about hitting a particularly prosperous period where they received a bonus, or a spouse entered the labor market, or there was a change of jobs. These are the types of events that can throw households above particular income thresholds.

Ultimately, this information casts serious doubt on the notion of a rigid class structure in the United States based upon income. It suggests that the United States is indeed a land of opportunity, that the American dream is still possible — but that it is also a land of widespread poverty. And rather than being a place of static, income-based social tiers, America is a place where a large majority of people will experience either wealth or poverty — or both — during their lifetimes.

All together now:  Income, that comes in *household* paychecks, regardless of how many earners are contributing to that household income, is not wealth.  Wealth is how much money a household has in the bank and in investments and the assets they own, like real estate, businesses, land, cars, boats, and planes.

Wealth inequality is much greater than income inequality. It looks like this:

1

And breaking it down by race:

1

It is no small thing for any household to attain an annual income of a million dollars for even one year.

But it is an entirely different experience to have enough wealth that one can no longer worry about income at all, can work the tax system to mask enormous amounts of income,  can essentially withdraw from everyday contact with everyday Americans, can use one’s wealth to leverage political and economic power, and can know that the children in one’s household will never, ever want for a thing.

The “1%” was never about income alone.

Jane Van Galen, PhD, is a professor of education at the University of Washington, Bothell.  Her research focus is on socioeconomic class, education, and digital media. She writes for Education and Class, where this post originally appeared.

Flashback Friday. 

How do people in the U.S. become wealthy?  According to the myth of meritocracy, they do so by hard work: blood, sweat, tears, a trace of talent, and a tad bit of luck.  This is the story told in this two-page ad for U.S. Trust in The New Yorker:

On the first page we learn she’s rich, but she’s still a home-town girl at heart. On the second page, we learn a little about how she might have gotten so wealthy:

Note the first few sentences:

Who’s to say how it happened. A big idea. A gutsy work ethic. A lucky break here and there.

Well, uh…what about, “She inherited it”? That’s a pretty common way to end up with a whole bunch of houses and in need of a wealth management team.

The notion that rich people are rich because their parents are rich, however, interrupts the American mystique, the one where we are a country of self-made immigrants who pulled ourselves up by our bootstraps.  People, even people who inherited wealth, like to think that they’re rich because they worked hard.  Hence, the romanticization of the self-made millionaire in the ad and the corresponding invisibility of the inheritance loophole.

On the flipside, this narrative also supports the converse idea that the poor are poor because of their lack of personal efforts and merits.  Perhaps they didn’t have a “big idea’ or the “gutsy work ethic” that enabled them to profit from the lucky break that they inevitably encountered, right?

This ad is just one drop in the sea of propaganda that makes it seem right and normal that a small proportion of our population is able to hoard wealth and property.

This post originally appeared in 2008.

Gwen Sharp is an associate professor of sociology at Nevada State College. You can follow her on Twitter at @gwensharpnv.