class

We have the money and the know how to tackle most of our social problems.  Certainly unemployment, houselessness, and poverty.  So, why don’t we?

In large part it is because our socially created wealth remains outside social control.  Critical economic decisions are driven by private interests not the public good.  One result is hipster economics.

If you are not familiar with the concept, I recommend Sarah Kendzior’s The Perils of Hipster Economics. Here is the first part:

On May 16, an artist, a railway service and a government agency spent $291,978 to block poverty from the public eye.

Called psychylustro, German artist Katharina Grosse’s project is a large-scale work designed to distract Amtrak train riders from the dilapidated buildings and fallen factories of north Philadelphia. The city has a 28 percent poverty rate – the highest of any major U.S. city – with much of it concentrated in the north. In some north Philadelphia elementary schools, nearly every child is living below the poverty line.

Grosse partnered with the National Endowment of the Arts and Amtrak to mask North Philadelphia’s hardship with a delightful view. The Wall Street Journal calls this “Fighting Urban Blight With Art.” Liz Thomas, the curator of the project, calls it “an experience that asks people to think about this space that they hurtle through every day.”

The project is not actually fighting blight, of course – only the ability of Amtrak customers to see it.

1
Flickr creative commons, Knight Foundation.

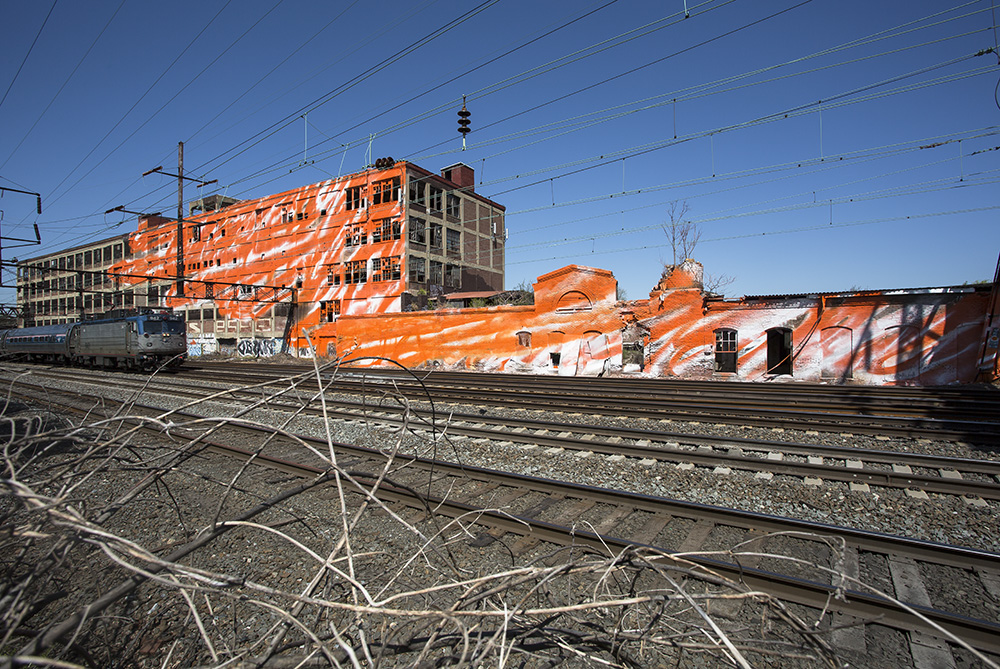
“I need the brilliance of colour to get close to people, to stir up a sense of life experience and heighten their sense of presence,” Grosse proclaims.

“People,” in Grosse and Thomas’s formulation, are not those who actually live in north Philadelphia and bear the brunt of its burdens. “People” are those who can afford to view poverty through the lens of aesthetics as they pass it by.

Urban decay becomes a set piece to be remodeled or romanticised.

The rest of the article is here.

Martin Hart-Landsberg is a professor of economics at Lewis and Clark College. You can follow him at Reports from the Economic Front.

1a

PhD Comics.

Lisa Wade, PhD is an Associate Professor at Tulane University. She is the author of American Hookup, a book about college sexual culture; a textbook about gender; and a forthcoming introductory text: Terrible Magnificent Sociology. You can follow her on Twitter and Instagram.

In a fancy bit of marketing, U.S. capitalists have been reborn as “job creators.”  As such, they were rewarded with lower taxes, weaker labor laws, and relaxed government regulation. However, despite record profits, their job creation performance leaves a lot to be desired.

According to the official data the last U.S. recession began in December 2007 and ended in June 2009. Thus, we have officially been in economic expansion for almost five years.  The gains from the expansion should be strong and broad-based enough to ensure real progress for the majority over the course of the business cycle.  If not, it’s a sign that we need a change in our basic economic structure.  In other words, it would be foolish to work to sustain an economic structure that was incapable of satisfying majority needs even when it was performing well according to its own logic.

A recent study by the National Employment Law Project titled The Low-Wage Recovery provides one indicator that it is time for us to pursue a change.  It shows that the current economic expansion is transitioning the U.S. into a low wage economy.

The figure below shows the net private sector job loss by industries classified according to their medium wage from January 2008 to February 2010 and the net private sector job gain using the same classification from March 2010 to March 2014. As we can see, the net job loss in the first period was greatest in high wage industries and the net job creation in the second period was greatest in low wage industries.

1 (2) - Copy

As the study explains:

 The food services and drinking places, administrative and support services (includes temporary help), and retail trade industries are leading private sector job growth during the recent recovery phase. These industries, which pay relatively low wages, accounted for 39 percent of the private sector employment increase over the past four years.

If the hard times of recession disproportionately eliminate high wage jobs and the “so called” good times of recovery bring primarily low wage jobs, it is time to move beyond our current focus on the business cycle and initiate a critical assessment of the way our economy operates and in whose interest.

Cross-posted at Pacific Standard.

Martin Hart-Landsberg is a professor of economics at Lewis and Clark College. You can follow him at Reports from the Economic Front.

I am so pleased to have stumbled across a short excerpt from a talk by Alan Watts, forwarded by a Twitter follower.  Watts makes a truly profound argument about what money really is.  I’ll summarize it here and you can watch the full three-and-a-half minute video below if you like.

Watts notes that we like to talk about “laws of nature,” or “observed regularities” in the world.  In order to observe these regularities, he points out, we have to invent something regular against which to compare nature. Clocks and rulers are these kinds of things.

All this is fine but, all too often, the clocks and the rulers come to seem more real than the nature that is being measured.  For example, he says, we might think that the sun is rising because it’s 6AM when, of course, the sun will rise independently of our measures.  It’s as if our clocks rule the universe instead of vice versa.

He uses these observations to make a comment about wealth and poverty. Money, he reminds us, isn’t real. It’s an invented measure.  A dollar is no different than a minute or an inch.  It is used to measure prosperity, but it doesn’t create prosperity any more than 6AM makes the sun rise or a ruler gives things inches.

When there is a crisis — an economic depression or a natural disaster, for example — we may want to fix it, but end up asking ourselves “Where’s the money going to come from?”  This is exactly the same mistake that we make, Watts argues, when we think that the sun rises because it’s 6AM.  He says:

They think money makes prosperity. It’s the other way around, it’s physical prosperity which has money as a way of measuring it.  But people think money has to come from somewhere… and it doesn’t. Money is something we have to invent, like inches.

So, you remember the Great Depression when there was a slump?  And what did we have a slump of?  Money.  There was no less wealth, no less energy, no less raw materials than there were before. But it’s like you came to work on building a house one day and they said, “Sorry, you can’t build this house today, no inches.”

“What do you mean no inches?”

“Just inches!  We don’t mean that… we’ve got inches of lumber, yes, we’ve got inches of metal, we’ve even got tape measures, but there’s a slump in inches as such.”

And people are that crazy!

This is backward thinking, he says.  It is allowing money to rule things when, in reality, it’s just a measure.

I encourage you to watch:

Lisa Wade, PhD is an Associate Professor at Tulane University. She is the author of American Hookup, a book about college sexual culture; a textbook about gender; and a forthcoming introductory text: Terrible Magnificent Sociology. You can follow her on Twitter and Instagram.

Here’s solid data on how some white Americans see black Americans:

1H/t New York Times.

Lisa Wade, PhD is an Associate Professor at Tulane University. She is the author of American Hookup, a book about college sexual culture; a textbook about gender; and a forthcoming introductory text: Terrible Magnificent Sociology. You can follow her on Twitter and Instagram.

“Stay-at-home mother” evokes black and white images of well-coiffed women in starched aprons. Rather than a vestige of a bygone era, stay-at-home moms are on the rise, according to the findings of a new Pew Research study. In 2012, 29% of women with children under the age of 18 stayed home, a number that has been on the rise since 1999 and is 3% higher than in 2008.

However, while more women are staying home with their children, the face of the stay-at-home mom has changed dramatically since the 1950s “Leave It to Beaver” days. Stay-at-home moms today are less educated and more likely to live in poverty than working moms. Younger mothers and immigrant mothers also make up a good portion of stay-at-home moms.

The story of why mothers are staying home is more complex than you may imagine and has more to do with the poor labor market, the exorbitant price of child care, and the contemporary structure of work. In a recent interview with Wisconsin Public RadioBarbara Risman, a sociologist at the University of Illinois at Chicago, spoke about how this report has been picked up by the mainstream media:

What’s surprising to me is the headlines and how it’s portrayed in the news. Although the numbers are going up, when you look at what mothers say, 6% of the mothers in this study say they are home because they can’t find a job. When you take those 6% of mothers out, the results are rather flat. Part of the real story here then is that it’s hard to find a job that allows you to work and covers your child care, particularly if you have less education and your earning potential isn’t very high.

These days stay-at-home moms, who are more likely to be less educated, are not able to make enough money for working to even be worthwhile. Many times, their pay wouldn’t actually cover the cost of child care. Beyond these important financial considerations, lower wage shift work makes it extremely difficult to coordinate child care in the midst of work schedules that change on a weekly basis.

Erin Hoekstra is pursuing a PhD in Sociology at the University of Minnesota. This post originally appeared on Citings and Sightings and you can read all of Erin’s contributions to The Society Pages here.  Cross-posted at Pacific Standard.

These are not fancy glasses:

1b

They’re celery vases and they’re exactly what they sound like: vases for celery.   In the late 1800s, people used these vases to ostentatiously present celery to their guests. Celery, you see, was a status food: a rare delicacy that only wealthy families could afford and, therefore, a way to demonstrate your importance to guests.

As celery began to decline in importance — cheaper varieties became available and its role for the elite declined — celery vases were replaced by celery dishes.   “Less conspicuous on the dining table,” writes decorative arts consultant Walter Richie, “the celery dish reflected the diminishing importance of celery.”

1a

Lisa Wade, PhD is an Associate Professor at Tulane University. She is the author of American Hookup, a book about college sexual culture; a textbook about gender; and a forthcoming introductory text: Terrible Magnificent Sociology. You can follow her on Twitter and Instagram.

The short answer is, pretty well. But that’s not really the point.

In a previous post I complained about various ways of collapsing data before plotting it. Although this is useful at times, and inevitable to varying degrees, the main danger is the risk of inflating how strong an effect seems. So that’s the point about teen test scores and adult income.

If someone told you that the test scores people get in their late teens were highly correlated with their incomes later in life, you probably wouldn’t be surprised. If I said the correlation was .35, on a scale of 0 to 1, that would seem like a strong relationship. And it is. That’s what I got using the National Longitudinal Survey of Youth. I compared the Armed Forces Qualifying Test scores, taken in 1999, when the respondents were ages 15-19 with their household income in 2011, when they were 27-31.

Here is the linear fit between between these two measures, with the 95% confidence interval shaded, showing just how confident we can be in this incredibly strong relationship:

1 (2) - Copy

That’s definitely enough for a screaming headline, “How your kids’ test scores tell you whether they will be rich or poor.” And it is a very strong relationship – that correlation of .35 means AFQT explains 12% of the variation in household income.

But take heart, ye parents in the age of uncertainty: 12% of the variation leaves a lot left over. This variable can’t account for how creative your children are, how sociable, how attractive, how driven, how entitled, how connected, or how White they may be. To get a sense of all the other things that matter, here is the same data, with the same regression line, but now with all 5,248 individual points plotted as well (which means we have to rescale the y-axis):

1 (2)

Each dot is a person’s life — or two aspects of it, anyway — with the virtually infinite sources of variability that make up the wonder of social existence. All of a sudden that strong relationship doesn’t feel like something you can bank on with any given individual. Yes, there are very few people from the bottom of the test-score distribution who are now in the richest households (those clipped by the survey’s topcode and pegged at 3 on my scale), and hardly anyone from the top of the test-score distribution who is now completely broke.

But I would guess that for most kids a better predictor of future income would be spending an hour interviewing their parents and high school teachers, or spending a day getting to know them as a teenager. But that’s just a guess (and that’s an inefficient way to capture large-scale patterns).

I’m not here to argue about how much various measures matter for future income, or whether there is such a thing as general intelligence, or how heritable it is (my opinion is that a test such as this, at this age, measures what people have learned much more than a disposition toward learning inherent at birth). I just want to give a visual example of how even a very strong relationship in social science usually represents a very messy reality.

Cross-posted at Family Inequality and Pacific Standard.

Philip N. Cohen is a professor of sociology at the University of Maryland, College Park, and writes the blog Family Inequality. You can follow him on Twitter or Facebook.