class

I’m on a plane right now, flying from Sacramento back to Albany. And sitting here I’m reminded of how air travel itself reflects the growing inequality of society in a trivial, but suggestive, way.

Planes have always had first-class and passenger cabins, at least as far as I know. If the Titanic had this distinction, I’m guessing it was in place from the beginning of commercial aviation.

But for most of my adult life, planes — at least the ones I usually fly on, from one U.S. city to another — looked something like this:

1 (3) - Copy

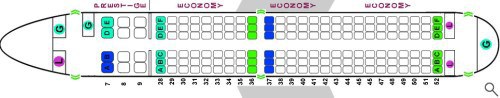
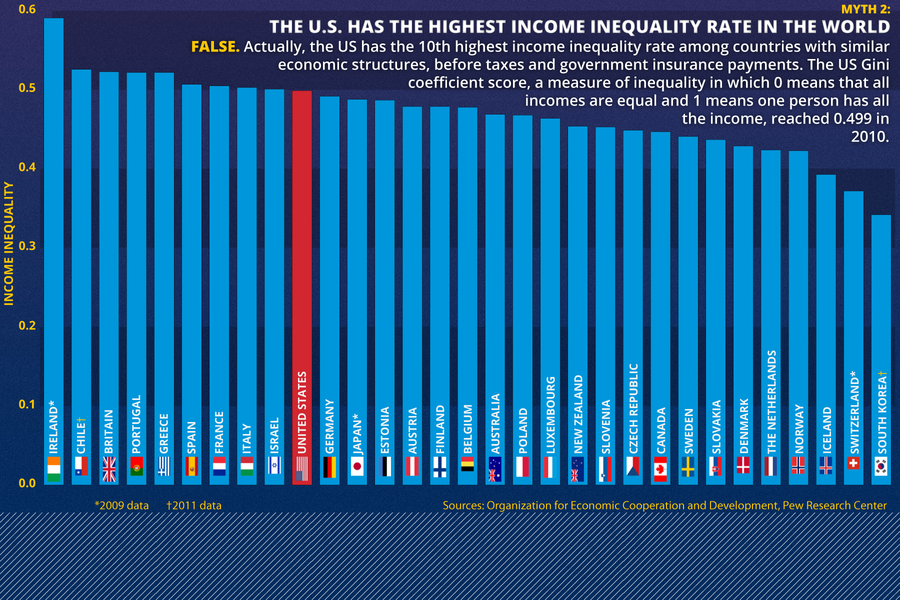
Just roughing it out here, this means that 7% of the passengers used about 15% of the room, with the other 93% using 85% of the cabin space. Such a plane would have a Gini index of about 8. The Gini index is measure of inequality, a fancy statistical way of representing inequality in the income distribution of a country’s population. For reference, the U.S. Gini is about 48, and the global one is around 65.

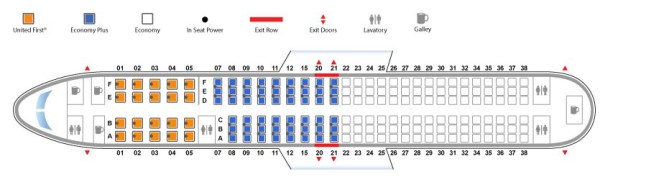
Domestic airlines have pretty much moved to a three-tier system now, in which the traditional first-class seating is supplemented by “Economy Plus,” in which you get an extra three or four inches of legroom over the standard “Economy” seats. I, as usual, am crammed into what should really be called “Sardine Class” — where seats now commonly provide a pitch of 31”, a few inches down from what most planes had a decade ago.

In today’s standard U.S. domestic configuration, the 12% of people in first class use about 25% of the passenger space, the 51 people in Economy Plus use another 30%, leaving the sardines — the other 157 people — with 45%. That gives us a Gini index of about 16.

1 (3)

Transatlantic flights, however, are increasingly taking this in-the-air distinction to new heights. Take, for example, the below United configuration of the Boeing 777. It boasts seats that turn into beds on which one can lie fully horizontal. United calls this new section of bed-seats “BusinessFirst.”

1 (4) - Copy

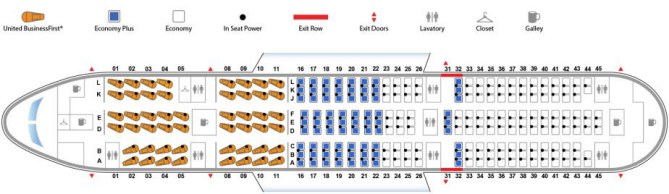
Unsurprisingly, though, these air-beds take up even more space than a nice comfy first class seat. So if we look again at how the space is distributed, we now have 19% of the people using about 35% of the plane, 27% using another 25%, and the final 52% using the last 40%. The Gini index has now increased to 25.

It’s not often you see such a clear visual representation of our collective acceptance of the right of a small fraction of people to consume a very disproportionate percentage of resources. I wonder how much of the shift is actually driven by increased inequality, as opposed to improved capacity for price discrimination.

And it’s also worth noting that the plane above, while unequal relative to the old-fashioned three-rows-of-first-class-and-the-rest-economy layout, is still nowhere near the inequality of the U.S., or the world.

Elizabeth Popp Berman, PhD is an associate professor of sociology at the University at Albany.  She is the author of Creating the Market University: How Academic Science Became an Economic Engine and regularly blogs at OrgTheory, where this post originally appeared.

Flashback Friday.

New York Times article broke the story that a preference for boy children is leading to an unlikely preponderance of boy babies among Chinese-Americans and, to a lesser but still notable extent, Korean- and Indian-Americans.

15birthgraficenlarge1

Explaining the trend, Roberts writes:

In those families, if the first child was a girl, it was more likely that a second child would be a boy, according to recent studies of census data. If the first two children were girls, it was even more likely that a third child would be male.

Demographers say the statistical deviation among Asian-American families is significant, and they believe it reflects not only a preference for male children, but a growing tendency for these families to embrace sex-selection techniques, like in vitro fertilization and sperm sorting, or abortion.

The article explains the preference for boy children as cultural, as if Chinese, Indian, and Korean cultures, alone, expressed a desire to have at least one boy child.  Since white and black American births do not show an unlikely disproportion of boy children, the implication is that a preference for boys is not a cultural trait of the U.S.

Actually, it is.

In 1997 a Gallup poll found that 35% of people preferred a boy and 23% preferred a girl (the remainder had no preference). In 2007 another Gallup poll found that 37% of people preferred a boy, while 28% preferred a girl.

I bring up this data not to trivialize the preference for boys that we see in the U.S. and around the world, but to call into question the easy assumption that the data presented by the New York Times represents something uniquely “Asian.”

Instead of emphasizing the difference between “them” and “us,” it might be interesting to try to think why, given our similarities, we only see such a striking disproportionality in some groups.

Some of the explanation for this might be cultural (e.g., it might be more socially acceptable to take measures to ensure a boy-child among some groups), but some might also be institutional. Only economically privileged groups have the money to take advantage of sex selection technology (or even abortion, as that can be costly, too). Sex selection, the article explains, costs upwards of $15,000 or more. Perhaps not coincidentally, Chinese, Korean, and Indian Asians are among the more economically privileged minority groups in the U.S.

Instead of demonizing Asian people, and without suggesting that all groups have the same level of preference for boys, I propose a more interesting conversation: What enables some groups to act on a preference for boys, and not others?

Originally posted in 2009.

Lisa Wade, PhD is an Associate Professor at Tulane University. She is the author of American Hookup, a book about college sexual culture; a textbook about gender; and a forthcoming introductory text: Terrible Magnificent Sociology. You can follow her on Twitter and Instagram.

Below are two figures. The first ranks the U.S. and other countries by income inequality before taxes and government interventions to reduce it. The second ranks the same countries after taxes and intervention.

What we see is that, whatever we’re doing to reduce inequality, it’s not working nearly as well as what other countries with high levels of income inequality are doing, with the sole exception of Chile.

1 (3) 1 (4)

Thanks to Christian Science Monitor for the images and Martin Hart-Landsberg for the tip.

Lisa Wade, PhD is an Associate Professor at Tulane University. She is the author of American Hookup, a book about college sexual culture; a textbook about gender; and a forthcoming introductory text: Terrible Magnificent Sociology. You can follow her on Twitter and Instagram.

There was violence and unrest following the news that Darren Wilson would not be indicted. Some argued that this was proof that the people involved were bad people. Jay Smooth responds with a question: “How much do you think people can take?”

Here is a partial transcript of his 5min discussion, embedded below:

Riots are things that human beings do because human beings have limits.

We don’t all have the same limits. For some of us, our human limit is when our favorite team loses a game. For some of us, it’s when our favorite team wins a game.

The people of Ferguson had a different limit than that. For the people of Ferguson, a lifetime of neglect and defacto segregation and incompetence and mistreatment by every level of government was not their limit.

When that malign neglect set the stage for one of their children to be shot down and left in the street like a piece of trash… that was not their limit.

For the people of Ferguson, spending one hundred days almost entirely peacefully protesting for some measure of justice for that child  and having their desire for justice treated like a joke by every local authority… was not their limit.

And then after those 100 days, when the so-called prosecutor waited till the dead of night to twist that knife one last time. When he came out and confirmed once and for all that Michael Brown’s life didn’t matter…

Only then did the people of Ferguson reach their limit.

So when you look at what happened Monday night, the question you should be asking is how did these human beings last that long before they reached their human limit? How do black people in America retain such a deep well of humanity that they can be pushed so far again and again without reaching their human limit?

Riots? Violence? Unrest?

That is what happens when you treat human beings that way.

Watch to the whole thing:

A four minute introduction to Marxism, featuring Super Mario Bros., by Wisecrack:

Lisa Wade, PhD is an Associate Professor at Tulane University. She is the author of American Hookup, a book about college sexual culture; a textbook about gender; and a forthcoming introductory text: Terrible Magnificent Sociology. You can follow her on Twitter and Instagram.

A new paper by Martha Stinson and Christopher Wignall found that 9.6% of working-age men were working for their dad in 2010. The likelihood of nepotistic opportunism was related to class, generally climbing with the father’s income.

2

This is just a “snapshot,” writes Matt O’Brien for The Washington Post. It’s just one year. If we consider whether men have ever worked for their dads, the numbers get much higher. More than a quarter of men spend at least some time working for the same company as their fathers before their 30th birthday. O’Brien also cites a study by economist Miles Corak revealing that 70% of sons of the 1% in Canada have worked at the same place as their dad.

As O’Brien says: “The easiest way to get your foot in the door is for your dad to hold it open for you.”

Cross-posted at Pacific Standard.

Lisa Wade, PhD is an Associate Professor at Tulane University. She is the author of American Hookup, a book about college sexual culture; a textbook about gender; and a forthcoming introductory text: Terrible Magnificent Sociology. You can follow her on Twitter and Instagram.

Social mobility refers to likelihood that a person born in one social class will end up in another as an adult. A new study by Richard Reeves and Isabel Sawhill for the Brookings Institute offered a devastating picture of the possibilities for black youth. To summarize: most black children see downward mobility and are poorer as adults than they were as children.

4More than half of black children born into the poorest 1/5th of households will remain there as adults. That’s only true for 36% of similarly-situated Americans overall. Poor black children, then, are less likely than Americans in general to be able to escape poverty.

Black children born into the middle class — literally the middle 5th of Americans as measured by household income — overwhelmingly see downward mobility. 16% will remain somewhere in the middle, 14% will be richer than their parents, and a whopping 69% will end up less economically stable. In comparison, only 38% of Americans, overall, born into the middle 5th see a decline in their status as adults.

As you may have noticed from the hole in the far right of the chart, the researchers didn’t have enough cases to even estimate outcomes for blacks born rich.

Below is the data for whites (first) and all Americans (second) for comparison:

32Here’s the first author, Richard Reeves, explaining social mobility, using Legos of course:

H/t Joe Feagin. Cross-posted at Pacific Standard.

Lisa Wade, PhD is an Associate Professor at Tulane University. She is the author of American Hookup, a book about college sexual culture; a textbook about gender; and a forthcoming introductory text: Terrible Magnificent Sociology. You can follow her on Twitter and Instagram.

Electing Republicans will certainly not improve things, but it is hard to blame people for feeling that the Democratic Party has abandoned them.

President Obama had hoped that recent signs of economic strength would benefit Democrats in the recently completed election.  Job creation has picked up, the unemployment rate is falling, and growth is stronger. Yet, most Americans have not enjoyed any real gains during this so-called expansionary period.

The following two charts highlight this on the national level.  The first shows how income gains made during the expansion period have been divided between the top 1% and everyone else.   There is not a lot to say except that there is not a lot of sharing going on.

1 (3) - Copy

The second shows trends in real median household net worth.  While declines in median net worth are not surprising in a recession, what is noteworthy is that median net worth has continued to decline during this expansion.  Adjusted for inflation the average household is poorer now than in 1989.

2

Oregon provides a good example of state trends.  The chart below shows that the poverty rate in Oregon is actually higher now than it was during the recession.

1 (4)

The poverty rate for children is even higher. In 2013, 21.6 percent of all Oregon children lived in families in poverty.

And, not surprisingly, communities of color experience poverty rates far higher than non-Hispanic whites.

1

More promising is movement building to directly advance community interests.  One example: voters in five states passed measures to boost minimum wages.   Another was the successful effort in Richmond, California to elect progressives to the city council over candidates heavily supported by Chevron, which hoped to dominate the council and overcome popular opposition to its environmental and health and safety policies.

Originally posted at Reports from the Economic FrontCross-posted at Pacific Standard.

Martin Hart-Landsberg is a professor of economics at Lewis and Clark College. You can follow him at Reports from the Economic Front.