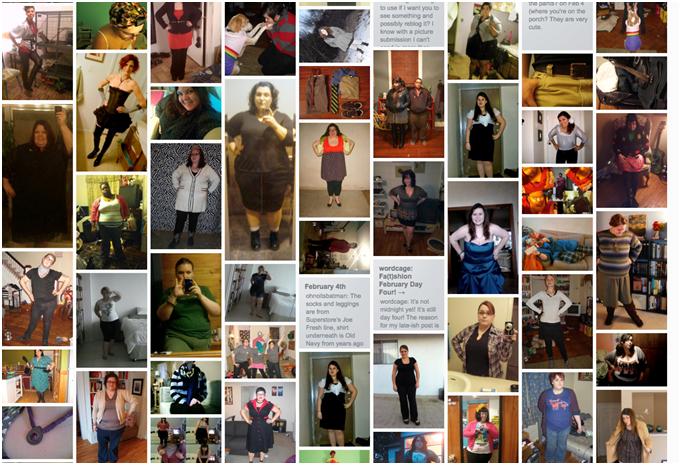
When Jessie Dress of Austin, Texas started the project Fa(t)shion February for Femmes and Friends, she was responding to what she perceived as a gap in the online community celebrating “fatshion,” or fashion for fat-identified people.   She explains, “I don’t feel like the fatshion blogs I see really represent the kind of radical queer fashion that I’m into and that feels like my community.”   Jessie committed to posting “outfits of the day” (OOTD) every day in February.  Her intention was to celebrate and draw attention to three kinds of politicized fashion projects – first, fatshion;  second, the fashion of femme-identified queers; and finally, the fashion of allies of both fat and femme-identified people.

The result was Fa(t)shion February for Femmes & Friends – an inclusive space for posting OOTD for those who find themselves outside the mainstream fashion ideal.  What started as her small personal project with a close group of friends has since exploded, with over 350 people participating in some way – a number that grows by the day:

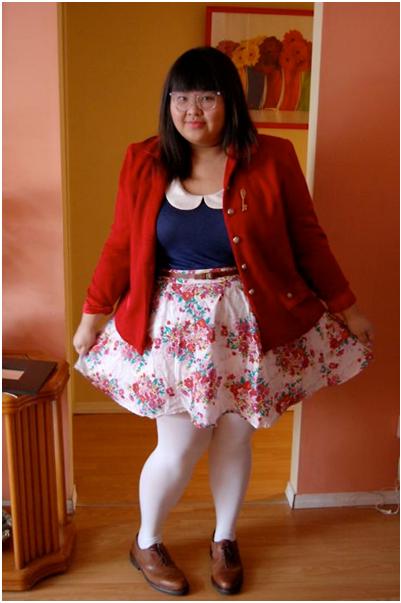
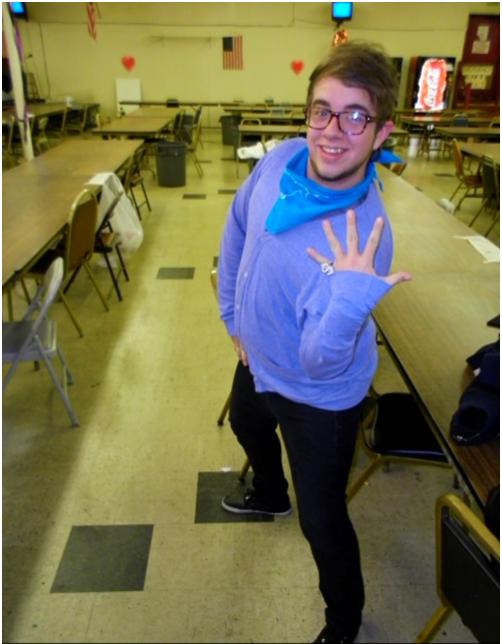
Fa(t)shion February participant Gazel (of Gazelma)

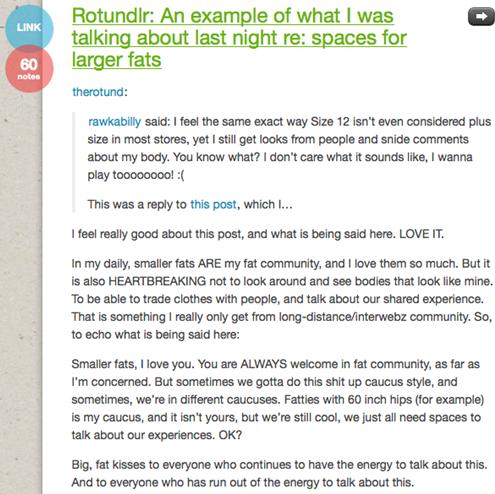
The aim of the project is to “queer” fashion in a number of ways – to celebrate the subversive possibility of fashion.  What’s exciting about how the Fa(t)shion February project has developed is the many different ways this aim has been realized.  For example, an amazing conversation has emerged through the project regarding the  “fat experience.”  Fa(t)shion February was created to be explicitly inclusive of those who are often missing from the fatshion dialogue – that is, individuals on the fattest end of the fat spectrum.  This privileging of “bigger fats” is an attempt to further radicalize the fatshion phenomenon, but it has come with its own set of dilemmas.  Some users expressed fear of participation because they aren’t “fat enough” or aren’t fat-identified.  In response to a conversation on The Rotund, Jessie wrote on her tumblr,

The kinds of difficult – but incredibly important – dialogues that are happening in and around the project are part of what makes it succeed in its mission to use fashion as a tool of social activism and community building.

[The rest of the post is after the jump just because it’s somewhat long.]

In addition to creating a space for these kinds of representations, the Fa(t)shion February project intends to celebrate and recognize queer and femme fashion.  As do many of the project participants, Jessie defines femme as a gender identity, a “radical and intentional” way of doing gender.  This is in contrast to the way femme has been perceived elsewhere — as a stereotypical and heteronormative complement to “butch.”  Instead, as Leah Lakshmi Piepzna-Samarasinha pronounced in a 2008 keynote address to Femme Con, “Femme is about finding a way to be a girl that doesn’t hurt.”

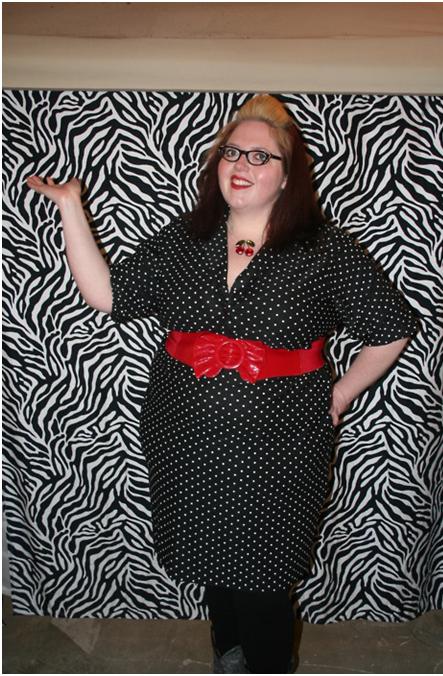
Fa(t)shion February participant Bevin (of Queer Fat Femme)

Another important aspect of femme identity that has been asserted in the project’s space is that femme identity isn’t exclusive to people assigned female at birth or  who identify as women:

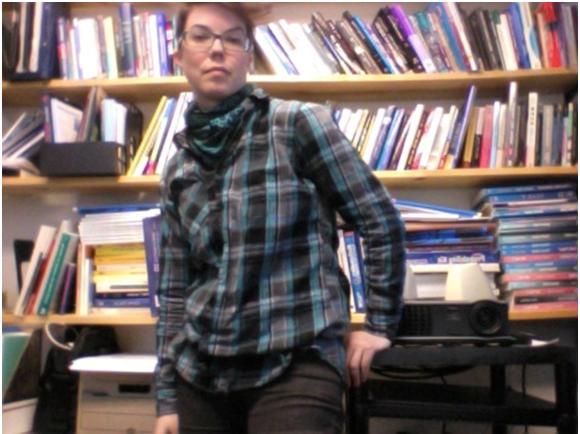
Fa(t)shion February participant Reid (of Dirties Do Fa(t)shion!)

Aside from body and gender politics, a discussion has emerged from the tumblr about challenging and resisting the inevitable commodification and commercialization that comes along with attention to fashion.  User Sassyfrass Circus asks,

Can we divorce our sartorial resistance from the psychological rush of finding the one cute dress on the rack that zips or even an entire store of clothes in your size (and conversely, the psychological crash of searching fruitlessly for a single item that fits), no matter what the social, political, or environmental implications of our consumption?

Sassyfrass points out an important limitation of the radical potential of projects like Fa(t)shion February — “the ever-present imperative to shop, to fall to the inevitable model of: Here is a picture of what I wore. Here is where you can buy it.”

That said, one of the fantastic things about the fashion that has predominated on Fa(t)shion February is the amount of thrifting/remixing/self-creating that is going on.  Jessie laments, “As a femme, it’s really something I hear a lot – that dressing well has to be expensive, especially if you are fat.”  For her, another facet of the radical possibilities of Fa(t)shion February is the way that users are dispelling this myth through creative sartorial strategies.  Further, Jessie likes that “people are comfortable posting in jeans and a t-shirt – especially for fatties, and female-identified folk, that can be really hard.”

As Jessie herself is quick to point out, not all marginalized people are being equally represented in the project.  The current typical user is white, urban, able-bodied, female-bodied, female/woman-identified, and around a US clothing size 18-22.  While there are people of color contributing regularly to the project, they are underrepresented amongst the site’s images.  Jessie says she would love to see more people over size 24, people of color, trans and genderqueer people, and differently-abled bodies in the project.  In many ways, the missing virtual voices mimic “real life” limits of community – such marginalization is an issue Jessie and others contend with in their political and community organizing outside the internet.  The limitations of the virtual space add another potential barrier in terms of access to both the internet and to virtual social networks, through which news of the project has spread.  However, it might also offer a way of bringing together geographically isolated individuals who might not otherwise have an opportunity to engage in the critique.

Fa(t)shion February participant: Demi Monde (of Inspiring Demimonde)

I asked Jessie if she was considering extending the project beyond February, given its popularity, and while she’s still working out what form that extension might take, she says she’s like to “keep engaging with people about the project and how it has affected them.”

Catherine Connell is an assistant professor of sociology at Boston University.  Her research interests include gender, sexuality, and organizations.  Her current project focuses on the identity negotiations of gay and lesbian teachers in California and Texas, states with disparate policies regarding LGBTQ employees.

————————–

UPDATE (from Gwen): While we always like to encourage discussion at Soc Images, some comments have crossed the line from commenting on the topic of the post to ridiculing participants. I’m monitoring the comments as closely as I can to delete any personal attacks on the individuals pictured here, etc.

UPDATE 2: Comments closed. I simply can’t be on top of every comment or moderate the comments post constantly to try to keep people on useful discussions or to quickly catch any personal attacks, etc.  Sorry, and maybe I’ll open them again later. Maybe not.

Recently I posted some maps showing global alcohol consumption. As a follow-up, here’s a map, via Blame It on the Voices, showing global consumption of coffee (with the rather major omission of China, among other nations, due to lack of data):

Consumption is measured in kilograms and, as ChartsBin explains, “Weight is presented as Green Bean Equivalent (GBE). 1 pound roasted coffee = 1.19 pounds of green coffee beans.”

Scandinavians drink the most coffee, on average. Based on the most recent available data, Finland, at 12 kg GBE each per year, tops the charts, and Norway, Denmark, and Sweden also make it into the top 10 (from ChartsBin):

The U.S. comes in at #26, consuming 4 kg/person annually. Apparently we’re too busy drinking beer to get serious about coffee.

Cross-Posted at BagNewsNotes.

We have posted in the past about how airlines use images of female flight attendants in ads to appeal to customers with promises of caretaking, eye candy, flirtation, and emotion work. Katrin sent in another example. This Cathay Pacific ad, which appeared in the U.K.,  presents Karina Yau, a flight attendant, to customers as the perfect caretaking woman — one who just wants to listen to you, not talk:

Notice also the passive stance — arms pulled into the body, her face turned away and eyes averted, hand fiddling with her coat sleeve. The text reads:

Karina went from fashion model to flight attendant — and still doesn’t think that life has had any real ups and downs. You can meet her and other members of the Cathay Pacific team at www.cathaypacific.co.uk. And while you’re there, check out our great fares to over 110 destinations worldwide. If you see Karina on your next flight, you might recommend a favourite book — she loves to read.

A post on the Cathay Pacific blog about Yau describes her as “modest.” At Cathay’s website you can “meet the team who go the extra mile to make you feel special.” It includes photos and bios of some employees, and I found Yau’s. The text they chose to highlight reinforces the emotion work she engages in for customers — “of course” she “smiled and apologised immediately.”

The ad and the features present customers with the promise of more than just a flight attendant who will do her job well. This flight attendant is the ideal of femininity: she’s beautiful (a former model), she’s submissive (apologizes immediately!), and she’s interested in you — your thoughts, your taste in books — whoever you are.

I wonder to what degree this draws on a specifically racialized femininity — the stereotypical depiction of Asian women as particularly submissive and docile. But since this ad ran in the U.K., I don’t know if that stereotype is as relevant. Readers, what say you?

Thelittlepecan let us know that the World Health Organization has out a new report about global alcohol consumption, as well as the consequences of that consumption. Overall consumption varies significantly, with the highest levels in Russia and much of Europe and the lowest in northern Africa through Asia (the consumption figures exclude tourists):

There are also clear differences in the most-consumed type of alcoholic drinks:

The report also looks at what proportion of all male deaths are related to alcohol consumption, broken down by region, age, and sex. Globally, alcohol-related problems are the leading cause of death for males aged 15-59. For the regions, AFR = Africa, AMR = Americas, EMR = Eastern Mediterranean, EUR = Europe, SEAR = South East Asia, and WPR = Western Pacific:

Clearly the Americas and Europe stand out, though this is  likely because those regions have lower death rates from many sources that are still prevalent in many parts of the world and, thus, alcohol-related ones show up more prominently.

Differences in blood-alcohol limits for drivers:

If you’re interested in more details, you can also get profiles of individual countries in each region at the WHO website.

Cross-posted at Ms.

Kelly V. suggested that I check out the book Traffic: Why We Drive the Way We Do (and What It Says about Us), by Tom Vanderbilt. The book is fascinating, covering everything from individual-level psychological and perceptual factors that affect our driving to system-level issues like why building additional roads often simply creates more traffic rather than alleviating it.

Among other things, it turns out that there are clear gender patterns in our driving; in particular, women do more driving as part of their family responsibilities. As Alan Pisarski, a traffic policy consultant, explains,

If you look at trip rates by male versus female, and look at that by size of family…the women’s trip rates vary tremendously by size of family. Men’s trip rates look as if they didn’t even know they had a family. The men’s trip rates are almost independent of family size. What it obviously says is that the mother’s the one doing all the hauling. (p. 135)

Nancy McGuckin and Yukiko Nakamoto looked at “trip chaining,” or making short stops on the way to or from work. They report that women tend to work closer to home (measured “as the crow flies,” or the great circle distance — GCD) than men in the same occupational categories (McGuckin and Nakamoto, p. 51)):

Research suggests a couple of possibilities for this pattern. Women, taking into account their family responsibilities, may look for closer jobs than men do so it will be easier to balance work and home life. It may also be that the types of jobs women are more likely to hold are more decentralized than men’s jobs and so more likely to be found closer to residential neighborhoods (although the graph above is broken down by occupational category, we see significant gender segregation in jobs within those broad categories).

Overall, men drive more total miles, and spend more time driving, per day, but women make more trips, particularly once they have children (p. 51):


Women are more likely to engage in trip chaining, and men and women differ in the types of stops they make. Men and women both stop to grab meals or coffee for themselves (in fact, the increase in these types of stops by men is so striking it earned a name, the “Starbucks effect”). However, more of the stops women make are to “serve passengers” — that is, going somewhere only because the passenger needs to, such as dropping a child off at school or childcare — or to complete shopping or family errands (p. 54):

Overall, 2.7 million men and 4.3 million women pick up or drop off (or both) a child during their work commute, according to federal data. Among households with two working parents who commute, women make 66% of the trips for drop offs/pick ups (p. 53)

This next graph isn’t related, but I’m throwing it in as a bonus. Sirkku Laapotti found that in both 1978 and 2001, men rated their own driving skills higher, on average, than women rated theirs…but both sexes thought they were way better drivers than people in 1978 did:

[Both papers are from Research on Women’s Issues in Transportation — Report of a Conference. Volume 2: Technical Papers. Conference Proceedings 35 (2005). Washington, D.C.: Transportation Research Board. The McGuckin and Nakamoto paper, “Differences in Trip Chaining by Men and Women,” is found on p. 49-56. Laapotti’s paper, “What Are Young Female Drivers Made Of? Differences in Driving Behavior and Attitudes of Young Women and Men in Finland,” is on p. 148-154.]

We previously posted a series of Valentine’s Day cards featuring Native Americans. They aren’t the only racial group to be caricatured in cards, though. Carrie S. sent in this vintage Valentine, found at Adventures of Accordion Guy in the 21st Century, that presents a stereotyped Asian character (doing laundry even!), complete with mangled English:

I was able to locate more Asian-themed racist vintage Valentine’s Day cards at Buzzfeed:

2 (2)

1 (4)


Gwen Sharp is an associate professor of sociology at Nevada State College. You can follow her on Twitter at @gwensharpnv.

The California Milk Processor Board, the group responsible for the Got Milk? and Happy Cows ad campaigns, produced “Medusa,” a commercial about a princess whose “ugly hair” destroys her chances for love…until, of course, a  man comes along who knows how to tame her hair, make her beautiful, and “conquer her love,” allowing her to finally get married:

I get that her hair is made up of snakes, but as a person with incredibly curly, unpredictable, shall we say boisterous hair, I can’t help but notice that the beauty ideal espoused here clearly calls for sleek, straight, controlled hair.

Sarah Haskins takes on the fairy tale trope in commercials aimed at women, including my favorite, a milk ad in which the princess’s PMS mood swings cause a tidal wave of her tears that threatens her entire realm:

You may have heard the good news last week that Bureau of Labor Statistics reports that the U.S. unemployment rate dropped to 9.0% in January, combined with the somewhat conflicting news that payrolls increased by only 36,000 jobs. How is unemployment dropping without a significant increase in the number of people working?

Talking Points Memo posted a graph that gives some insight, and it isn’t encouraging. The blue line shows the % of unemployed who stopped counting as unemployed because they found work. The red line, on the other hand, shows the % of unemployed workers who quit being unemployed because they have stopped looking for work, and thus are categorized as “not in the labor force” rather than unemployed. Currently, more of the drop in unemployment rates are due to people giving up on finding work rather than them finding jobs (via Rortybomb):

The Roosevelt Institute has a detailed report about trends in unemployment.

This pattern has significant long-term consequences, since a period of unemployment has serious negative effects on individuals’ income for years even after they do finally get jobs. This impacts not just individuals and their families, but entire communities, counties, and states, which suffer from the increased need for services, lowered productivity, and loss of tax revenue.