Clayton W. sent us a political mailer that recently went out against Rose Ferlita, a candidate for mayor of Tampa, Florida. What makes her unfit for office? Among other things, she’s single:

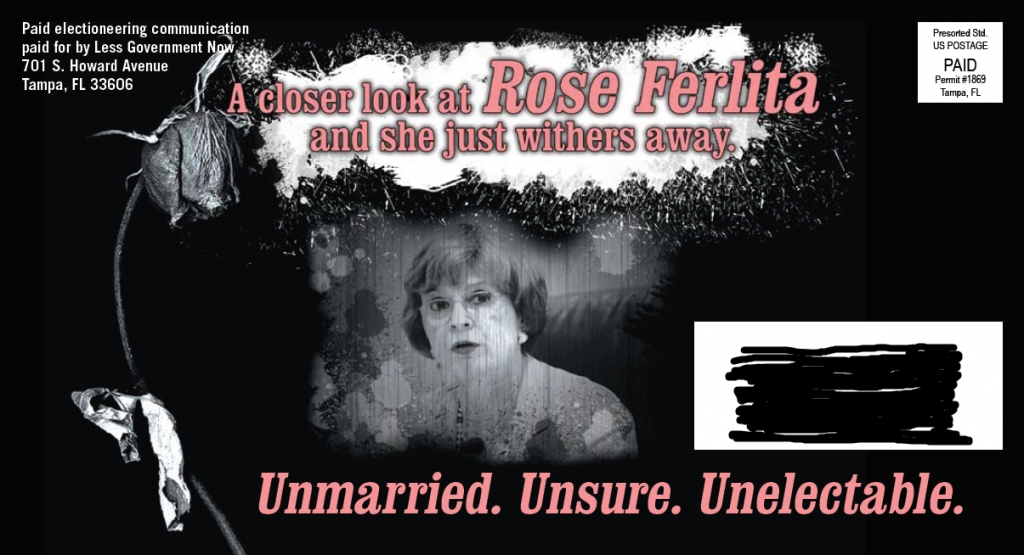
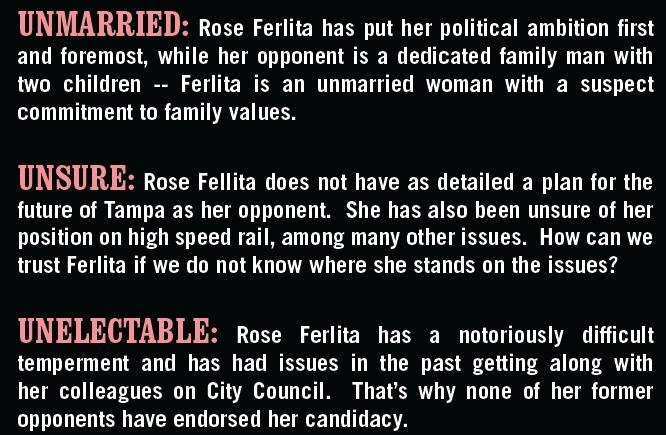
Text from the other side:

(Via Think Progress.)

So, awful, right? She’s single, she has a “suspect commitment to family values,” which I think it isn’t a stretch to say means “she might be a lesbian,” she’s a bitch. Given our current political alignments, we might legitimately assume this mailer was created by a very far right, possibly religious-based group, presumably on the conservative side of the spectrum.

But the story turns out to be weirder than that. Ferlita is a Republican, though Tampa’s mayoral races are non-partisan. The mailer, as you can see in the return address, is from Less Government Now, a 527 political action group (that is, one that can take unlimited donations as long as they do not directly advocate voting for a specific candidate). And it’s tied to a man named Scott Maddox, a Democrat who ran (unsuccessfully) for office last year. In that race, he had a friend enter the campaign as a fake Tea Party candidate in hopes of splitting the Republican vote.

It appears that Less Government Now is pursuing a similar strategy here, sending out materials that attack candidates from the right by coming up with the types of arguments they imagine will resonate with very conservative voters and thus split their vote. It doesn’t seem clear whether the other candidate for mayor of Tampa, Bob Buckhorn, had any knowledge of the mailer, or if Less Government Now acted on its own (Buckhorn has denounced the mailer).

I gotta say, I thought this was repugnant when I first saw it and assumed the group who put it out might actually believe this kind of crap. But to encourage people to vote based on sexist, homophobic values that you presumably don’t even agree with, simply as a political ploy? That is some nasty, nasty business.

UPDATE: Suzie emailed us about her post on March 20th at Echidne of the Snakes (there’s no way to link directly to the post, sorry) questioning the origin of the mailer. The St. Petersburg Times Tampa Bay site reports that according to the post office, the permit number listed on the mailer is fake, and there’s no evidence it was actually mailed. Less Government Now denies all knowledge of it. It’s possible that this is a fake mailer created to discredit the Democratic candidate by making it look a Democrat-affiliated group sent out something sexist. The person who first made it public, claiming to have received it anonymously, has been involved in political consulting and has a history of criminal charges. This is all making my head spin.

Leslee Beldotti sent in this 7-minute video from The Escapist that discusses female characters in video games and how game developers could incorporate women as complex characters rather than stereotypes. Leslee points out that the video somewhat conflates sex with gender in the discussion of biological vs. social behaviors, but it highlights the outcomes of making video games through a gendered lens (sorry about the 30-second intro ad):

On this topic, also see Lisa’s recent post on boob inflation in video games.

Squee sent in this video on the complexities of the placebo effect. We most often hear about the placebo effect in terms of medicine (the famed “sugar pill” that makes people feel better despite having no known effect on a condition), but as the video points out, we use placebos in other aspects of social life as well, such as buttons at intersections that don’t affect the timing of the “walk” signal but make pedestrians feel better about their wait anyway. And since the placebo effect is based in part on cultural assumptions about what should make us feel better (i.e., an expensive drug must be better than a discounted one, right?), not surprisingly the effectiveness of specific placebos varies cross-culturally.

Fun!

As a number of readers emailed us to point out, yesterday was International Women’s Day, designed to highlight both women’s accomplishments and the persistence of gender inequality worldwide. Ben Buursma noticed an ad in an Indonesian newspaper celebrating International Women’s Day and marketing “Books to empower all women,” though it turns out what they empower women to do is “look into the minds of men” and “find, keep, and understand a man”:

Emma M. H. sent in a link to the the White House Council on Women and Girls report on the status and well-being of U.S. women on a variety of social indicators. Interestingly, while both men and women are waiting longer to get married, the gender gap in age at first marriage has remained relatively constant for decades:

Men are more likely to be either married and never-married, while women currently more likely than men to be divorced or widowed:

Over time, the percent of women who have never given birth has gone up, particularly for the 25-29 age group, though in the last decade there has been a slight downward trend for women aged 30-44:

One note about that graph: the report uses the phrase “had a child” and “childbearing,” so I think this data would include women who have adopted children but never given birth.

I was surprised to see that rates of Cesarean sections have gone up in the past decade:

Women are now outperforming men in terms of educational attainment, earning the majority of bachelor’s degrees, though notice the number of degrees in engineering/computer science earned by women hasn’t increased since 1998:

However, women still make less than men at each level of educational attainment:

The report has lots more data on family life, work, education, health, crime, and so on. I’ll post on other topics in the future.

Finally, Ben N., Kay C., Gregory S., and Dave Z. all sent in this video starring Daniel Craig that highlights global gender inequality (though unfortunately I can’t find any reference that provides sources for the statistics in the video, so take it for what it’s worth):

Nearly two years ago I wrote a post about the discovery that the president of Jacksonville State University blatantly plagiarized large segments of his dissertation. Yet his Ph.D. was not revoked, nor did he lose his job or face any discipline, as far as I know.

Another case recently came to light. Karl-Theodor zu Guttenberg, Germany’s Defense Minister, admitted plagiarizing part of his dissertation. Flowing Data posted this graph, created by Gregor Aisch, that visualizes the extent of the plagiarism. The taller bars represent regular text, while the shorter bars are footnotes. The dark red bars are direct plagiarism; the bright red ones are “other” plagiarism, which I can’t explain to you because the page about it is in German:

In this case, however, status didn’t outweigh the plagiarism. The University of Bayreuth, where he earned his J.D. degree, revoked it; over 20,000 academics signed a petition to Chancellor Merkel complaining about her continued support for Guttenberg; and he ultimately resigned.

UPDATE: Reader Kat asked that I provide the link to the original source, GuttenPlag Wiki. Kat explains,

The dissertation was NOT run just through a computer programme- it was posted on the internet and then people “crowd-sourced” passages to find where they were really from.

Secondly, there is another good graphic that I believe you should include in your post lower down on the page I posted above:
– Black are pages on which one source was plagiarized
– Red are pages with plagiarism of more than one single source
– White are pages where SO FAR no plagiarism has been found
– Light blue are the index and annexes

In total Baronet zu Guttenberg plagiarized 76.34 % of his dissertation (annexes and index were not included to compute this percentage).

Thirdly: The entire dissertation was VERY likely written by a ghost writer. Guttenberg was a Member of Parliament the entire time when the PhD was allegedly “written” (copy and pasted).

Here is the image she desscribes from the GuttenPlag Wiki page:

And reader Ellen says,

I took a crack at the German explanation of the “other plagiarism” and I think it refers to instances where the source was incorrectly cited, quotation marks were conveniently forgotten and other things of that nature. In other words, plagiarism that isn’t directly copied and pasted.

I suspect the academic world would be horrified by the results if someone had time to sit down and systematically run dissertations through anti-plagiarism software.

UPDATE 2: Kat sent along another link that makes the degree of plagiarism even more obvious. It shows in thumbnail form each page that has plagiarism, and you can click on the thumbnail to see a side-by-side comparison of the original and Guttenberg’s dissertation. The updated Wiki page indicates that over 94% of pages were plagiarized. Finally, she clarifies what “other plagiarism” means:

  • A source text in a language other than German was translated word by word, with no quotation marks. The translation was made by the “Wissenschaftliche Dienst” (Science Service) of the Bundestag (German equivalent to CRS). So he illegally let them do research for his PhD (claiming it was for his work as MP)
  • plagiarism of structure: The structuring of an argument or an index or a graphic e.g.
  • Alibi footnote: There is a footnote, but it is insufficient. For example, a huge passage is an actual quotation, but the footnote and citation marks make it look as if only part of the sentence is a direct quote.
  • Shake & Paste: The text is made up of fragments of another text which were rearranged.

Kristina K. sent in a link to an interactive map at the New York Times that shows the results of Gallup’s 2010 polls of well-being. [UPDATE: Reader Danielle pointed out I forgot to provide a link to the map. Sorry! You can find it here.] Gallup surveys 1,000 people per day about a variety of indicators of well-being, including questions about physical, mental, and emotional health, various health-related behaviors, ability to access health care, access to adequate food and housing, and perceptions of their communities. Here are the overall composite scores, by congressional district (a higher score is better):


The general geographic pattern indicates a swath of relatively low well-being curving from Louisiana up through Michigan, while those in the upper Great Plains and the inter-mountain West are doing better than average.

Percent reporting experiencing a lot of stress:

Percent who have ever been told they have depression:

Of course, this may reflect differences in rates of depression, but it could also reflect differences in medical professionals’ likelihood of identifying a set of symptoms as depression and bringing it up with a patient. For example, we see significant differences by state in the frequency of Caesarean sections among pregnant women.

Percent of people who smoke:

Percent reporting an inability to buy sufficient food:

The Gallup page on well-being presents more data. Here is a map of 2009 overall well-being that is a bit easier to read since it’s presented by state rather than congressional district:

Hawaii had the highest overall score, at 70.2; West Virginia had the lowest, 60.5. If you go to their site and click on a state, you can get a breakdown of scores in each area (emotional well-being, physical health, healthy behaviors, and so on).

Finally, the NYT provides some demographic information on who was most likely to have said they spent a lot of the previous day laughing or smiling vs. being sad:

The Pew Research Center recently released data on stepfamilies in the U.S. Of the 2,691 respondents, over 40% had at least one step relative in the immediate family:

Note that they include both step- and half-siblings. For readers who might not be familiar with that language, a step-sibling is related to you only through marriage; you don’t share a biological parent. A half-sibling shares one parent with you, but not both. I can see the point of including both categories if you’re interested in seeing the degree to which American family life varies from the culturally-accepted “ideal” nuclear family, but I would think putting both in a single category might hide meaningful differences (such as for the question about obligation, below).

The chances of having a step-relative in the immediate family vary quite a bit based on demographics, reflecting differences in marriage, divorce, and non-marital childbearing rates:

The vast majority (70%) of people with step-relatives said they were very satisfied with their family lives, undermining some of the cultural stereotypes of stepfamilies as inherently filled with conflict. However, the survey also asked participants if they would feel “obligated” to help a family member who was facing serious problems and needed either financial help or caregiving. The results show more feelings of obligation to biological family members than to step-relatives:

I presume perceptions of obligation vary widely based on how old a person was when their parent married their stepparent, the quality of the relationship, and perhaps even whether the stepparent has biological children. The data would seem to have important implications for our ability to draw on family networks for resources. Who is responsible for caring for elderly parents, for instance? Only their biological children? Should someone feel obligated to help a person who they’re related to only because of a parent’s marital choice? Unclear cultural norms about obligations to step-relatives bring up a number of complex issues that many Americans will be forced to grapple with in the future.

The blog Of Another Fashion, by Minh-Ha T. Pham, serves as “an alternative archive of the not-quite-hidden but too often ignored fashion histories of U.S. women of color.” The collection includes images taken from public sources as well as photos sent in by readers and provides a contrast to fashion exhibits that usually present fashion trends as almost entirely White experiences.

While the collection is fascinating overall and definitely worth a look, I was particularly struck by the photos of life among Japanese Americans forced to live in internment camps during World War II.

A legal notice requiring Japanese Americans on the West Coast to relocate voluntarily to internment camps or face arrest:

Women playing volleyball:

(Library of Congress. Photo by Ansel Adams.)

Walking to school at the Manzanar camp:

(Library of Congress. Photo by Ansel Adams.)

Women in biology and dressmaking classes:

(Both images by Ansel Adams, 1943; Library of Congress.)

One camp’s version of a beauty salon:

Intake processing at the Santa Anita center:

(From the Library of Congress’ Farm Security Administration and Office of War Information Collection (April 1942). Photographer unknown.)

Pham discusses the fact that in many of the photos of the processing centers, the women are smiling and look very happy, despite going through what had to be an upsetting, frightening, and humiliating experience. Japanese Americans were not allowed to bring their own cameras into the camps; the photos were taken by others, including Dorothea Lange and Ansel Adams. And they found their subjects didn’t always cooperate with the images they were planning to provide of the camps:

According to Sue Kunitomi Embrey the chair of the Manzanar Committee, Adams hoped to capture the despair of camp life in order to stir some public sympathy for Japanese Americans but was frustrated by all the primping and posing Japanese Americans did when he was photographing.

…I hope that images of smiling and fashion-conscious Japanese American women…adds to and deepens our appreciation of the small acts of feeling, creativity, and resistance that happen everyday in spite of huge limitations. In an act as seemingly trivial and trite as smiling for the camera, these women interrupt and take some control of the historical, political, and visual frames through which they’re being viewed.