nation: United States

The year during which the U.S. will become a “majority minority” is well discussed.  It looks like it’s going to happen sometime around 2050 or earlier. This statistic, however, elides an interesting subplot: the year various age groups will be majority minority.

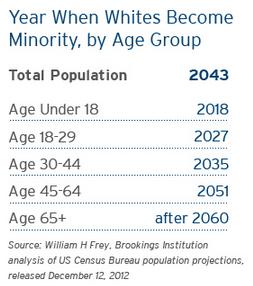
Over at The Society Pages Editors’ Desk, sociologist Doug Hartmann offered the following table. It shows that children under the age of 18 will be majority minority 32 years earlier, by 2018.  Young people ages 18-29 will join them by 2027.  By 2035, people aged 35-64 will be majority minority.  People 65 and older are quick to follow.

This data reminds us that demographic change is gradual.  The year 2018 is just five years away.  If young people continue to vote in numbers similar to those in the last two elections, their changing demographics could push forward a change that looks all but inevitable in the long run.

In the meantime, we need to be vigilant about how younger people are portrayed.  Today poverty is racialized so as to demonize social programs designed to help the less fortunate.  Can we imagine a future in which public education and other youth-oriented programming is similarly framed: as white people helping supposedly undeserving people of color?  This is likely something that we should be vigilant against in the coming years.

Lisa Wade, PhD is an Associate Professor at Tulane University. She is the author of American Hookup, a book about college sexual culture; a textbook about gender; and a forthcoming introductory text: Terrible Magnificent Sociology. You can follow her on Twitter and Instagram.

Cross-posted at Montclair SocioBlog.

“Silver Linings Playbook,” the new David O. Russell movie, starts off by making the audience uncomfortable.  We want to like Pat (Bradley Cooper).  We root for him to overcome the internal demons that landed him in a mental hospital for eight months.  We do like him.  But he keeps doing things we don’t like.  He is socially insensitive and often offensive, utterly absorbed in his own deluded ideas and obsessions, and although we know that these emanate from his psychiatric condition, it’s impossible to separate the personal from the psychiatric.  He is his mental illness, and it’s often not pretty. We’re actually glad to see the cop who shows up to enforce the restraining order.  (Usually in American films, when a uniformed cop restrains the hero, the moral question is so clear the cop might as well be wearing a Nazi uniform.)

At some point, the film takes a turn away from the complicated and difficult.  It calls on a smooth, familiar recipe and gives us comfort food — sweet chocolate pudding, spoonful after spoonful.  It’s made from good chocolate, but it’s predictable  pudding nonetheless.

It all leads up to a climactic scene that we all know from countless other movies.  In this case, it’s a ballroom dancing competition:

The movie plays on one long-standing idea in American movies and TV: all moral questions, all questions of character, can be settled in a contest. Typically, the story sets out some difficulties for the hero — conflicts with the society, conflicts with some other person or organization, conflicts within himself. It all leads up to some climactic  contest.  Usually the hero wins, occasionally he loses. But the outcome doesn’t matter so much as the nobility of the fight, for win or lose, the hero has fought, and that seems to resolve all issues.   Rocky is the obvious example…

That’s from six years ago in one of the first posts on this blog.  (I’ve edited it lightly.)  That post was about the first episode of Friday Night Lights.   But it could have been about “Silver Linings Playbook” — “Rocky” meets “Dancing With the Stars.”

For a nearly complete plot summary, watch the trailer.

The contest seems to melt all problems no matter how complicated, no matter how seemingly unrelated to the competition itself – problems between a man and a woman, a son and father, friend and friend.

“Silver Linings Playbook” hits all three of those plus husband and wife, brother and brother, and maybe some others.  Other seemingly insoluble problems – from Pat’s obsession with his estranged wife to the side effects of medications – vanish.  And in case the pudding wasn’t already sweet enough, there’s an added Hollywood-ending bonus involving a large bet on the Cowboys-Eagles game, an outcome so predictable I’m not even putting in a spoiler warning.

And they all live happily ever after.

These themes are not inherent in movie contests.  In British films of the sixties – “The Loneliness of the Long Distance Runner” or “This Sporting Life” for example – athletic contests bring a heightened consciousness of the class system.  But in American movies, regardless of the setting – the boxing ring, the pool hall, the poker game, the karate dojo, the dance floor, etc. – competition works its magic and allows the heroes to overcome all personal and interpersonal problems.

—————————

Jay Livingston is the chair of the Sociology Department at Montclair State University.  You can follow him at Montclair SocioBlog or on Twitter.

Cross-posted at Reports from the Economic Front.

One of the subthemes of current discussions about how best to reduce our national debt is that we must rein in out-of-control spending on federal safety net programs.   The reality is quite different.

The chart below shows spending trends in terms of GDP for the ten major needs-tested benefit programs that make-up our federal social safety net. The programs, in the order listed on the chart, are:

  • The refundable portion of the health insurance tax credit enacted in the 2010 health care reform law
  • Medicaid and the Children’s Health Insurance Program (CHIP)
  • The Supplemental Nutrition Assistance Program (SNAP)
  • Financial assistance for post-secondary students (Pell Grants)
  • Compensatory Education Grants to school districts
  • Assisted Housing
  • The Earned Income Tax Credit (EITC)
  • The Additional Child Tax Credit (ACTC)
  • Supplemental Security Income (SSI)
  • Family Support Payments

lowincprogs

As Jared Bernstein explains:

…for all the popular wisdom that programs to help low-income people are swallowing the economy, the truth is that like so much else that plagues our fiscal future, it’s all about health care spending.  The figure shows that as a share of GDP, prior to the Great Recession, non-health care spending was cruising along at around 1.5% for decades.  It was Medicaid/CHIP (Medicaid expansion for kids) that did most of the growing.

The takeaway from this: we need a new health care system (think single payer).

Regardless, the recent explosion in the ratio of Medicare/CHIP spending to GDP is largely due to the severity of the Great Recession, not the generosity of the programs. The recession increased poverty and thus eligibility for the programs, thereby pushing up the numerator, while simultaneously lowering GDP, the denominator.   Moreover, spending on all non-health care safety net programs is on course to dramatically decline as a share of GDP. Even Medicare/Chip spending is projected to stabilize as a share of GDP.

These programs are essential given the poor performance of the economy, and in most cases poorly-funded. Cutting their budgets will not only deny people access to health care, housing, education, and food, it will also further weaken the economy, in both the short and long run.

—————————

Martin Hart-Landsberg is a professor of Economics and Director of the Political Economy Program at Lewis and Clark College.  You can follow him at Reports from the Economic Front.

For the last week of December, we’re re-posting some of our favorite posts from 2012. Cross-posted at Global Policy TV and Pacific Standard.

Publicizing the release of the 1940 U.S. Census data, LIFE magazine released photographs of Census enumerators collecting data from household members.  Yep, Census enumerators. For almost 200 years, the U.S. counted people and recorded information about them in person, by sending out a representative of the U.S. government to evaluate them directly (source).

By 1970, the government was collecting Census data by mail-in survey. The shift to a survey had dramatic effects on at least one Census category: race.

Before the shift, Census enumerators categorized people into racial groups based on their appearance.  They did not ask respondents how they characterized themselves.  Instead, they made a judgment call, drawing on explicit instructions given to the Census takers.

On a mail-in survey, however, the individual self-identified.  They got to tell the government what race they were instead of letting the government decide.  There were at least two striking shifts as a result of this change:

  • First, it resulted in a dramatic increase in the Native American population.  Between 1980 and 2000, the U.S. Native American population magically grew 110%.  People who had identified as American Indian had apparently been somewhat invisible to the government.
  • Second, to the chagrin of the Census Bureau, 80% of Puerto Ricans choose white (only 40% of them had been identified as white in the previous Census).  The government wanted to categorize Puerto Ricans as predominantly black, but the Puerto Rican population saw things differently.

I like this story.  Switching from enumerators to surveys meant literally shifting our definition of what race is from a matter of appearance to a matter of identity.  And it wasn’t a strategic or philosophical decision. Instead, the very demographics of the population underwent a fundamental unsettling because of the logistical difficulties in collecting information from a large number of people.  Nevertheless, this change would have a profound impact on who we think Americans are, what research about race finds, and how we think about race today.

See also the U.S. Census and the Social Construction of Race and Race and Censuses from Around the World. To look at the questionnaires and their instructions for any decade, visit the Minnesota Population Center.  Thanks to Philip Cohen for sending the link.

Lisa Wade, PhD is an Associate Professor at Tulane University. She is the author of American Hookup, a book about college sexual culture; a textbook about gender; and a forthcoming introductory text: Terrible Magnificent Sociology. You can follow her on Twitter and Instagram.

Cross-posted at Chris Uggen’s Blog.

I’ve been reluctant to write about the terrible events at Sandy Hook Elementary School because the wounds are still too fresh for any kind of dispassionate analysis. As a social scientist, however, I’m disappointed by the fear-mongering and selective presentations of the research evidence I’ve read in reports and op-eds about Friday’s awful killing.

Such events could help move us toward constructive actions that will result in a safer and more just world — or they could push us toward counter-productive and costly actions that simply respond to the particulars of the last horrific event. I will make the case that a narrow focus on stopping mass shootings is less likely to produce beneficial changes than a broader-based effort to reduce homicide and other violence. We can and should take steps to prevent mass shootings, of course, but these rare and terrible crimes are like rare and terrible diseases — and a strategy to address them is best considered within the context of more common and deadlier threats to population health. Five points:

1. The focus on mass shootings obscures over 99 percent of homicide victims and offenders in the United States.

The numbers should not matter to parents who must bury their children, but they are important if policy makers are truly committed to reducing violent deaths. There are typically about 25 mass shootings and 100 victims each year in the United States (and, despite headlines to the contrary, mass shootings have not increased over the past twenty years). These are high numbers by international standards, but they pale relative to the total number of killings – about 14,612 victims and 14,548 offenders in 2011. In recent years, the mass shooters have represented less than two-tenths of 1 percent of the total offenders, while the victims have represented less than one percent of the total homicide victims in any given year. We are understandably moved by the innocence of the Sandy Hook children, but we should also be moved by scores of other victims who are no less innocent. There were 646 murder victims aged 12 or younger  in the United States in 2011 alone — far more than all the adults and children that died as a result of mass shootings.

2. The focus on mass shootings leads to unproductive arguments about whether imposing sensible gun controls would have deterred the undeterrable. 

As gun advocates are quick to point out, many of the perpetrators in mass shootings had no “disqualifying” history of crime or mental disorder that would have prevented them from obtaining weapons. And, the most highly motivated offenders are often able to secure weapons illegally. Even if such actions do little to stop mass shootings, however, implementing common-sense controls such as “turning off the faucet” on high capacity assault weapons, tightening up background checks, and closely monitoring sales at gun shows are prudent public policy. But the vast majority of firearms used in murders are simple handguns. I would expect the no-brainer controls mentioned above to have a modest but meaningful effect, but we will need to go farther to have anything more than an incremental effect on mass shootings and gun violence more generally.

3. The focus on mass shootings obscures the real progress made in reducing the high rates of violence in the United States. 

I heard one commentator suggest that America had finally “hit bottom” regarding violence. Well, this is true in a sense — we actually hit bottom twenty years ago. The United States remains a violent nation, but we are far less violent today than we were in the early 1990s. Homicide rates have dropped by 60 percent and the percentage of children annually exposed to violence in their households has fallen by 69 percent since 1993:

We can and should do better, of course, but these are not the worst of times.

4. The focus on mass shootings exaggerates the relatively modest correlation between mental illness and violence. 

Those who plan and execute mass shootings may indeed have severe mental health problems, though it is difficult to say much more with certainty or specificity because of the small number of cases in which a shooter survives to be examined. We do know, however, that the correlation between severe mental illness and more common forms of violence is much lower — and that many types of mental health problems are not associated with violence at all.

5. The focus on mass shootings leads to high-security solutions of questionable efficacy. 

Any parent who has attempted to drop off a kid’s backpack knows that security measures are well in place in many schools. Rates of school crime continue to fall, such that schools are today among the safest places for children to spend so many of their waking hours. In 2008-2009, for example, only 17 of the 1,579 homicides of youth ages 5-18 occurred when students were at school, on the way to school, or at school-associated events. Of course we want to eliminate any possibility of children being hurt or killed at school, but even a 2 percent reduction in child homicide victimization outside of schools would save more lives than a 90 percent reduction in school-associated child homicide victimization. While every school must plan for terrible disasters in hopes that such plans will never be implemented, outsized investments in security personnel and technology are unlikely to serve our schools or our kids.

In the aftermath of so many deaths I am neither so cynical as to suggest that nothing will change nor so idealistic as to suggest that radical reform is imminent. I’m just hoping that the policy moves we make will address our all-too-common horrors as well as the rare and terrible events of the past week.

—————————

Chris Uggen is a professor of sociology at the University of Minnesota and the author of  Locked Out: Felon Disenfranchisement and American Democracy, with Jeff Manza. You can follow him at his blog and on twitter.

Cross-posted at Kieran Healy’s blog.

The chart in “America is a Violent Country” has been getting a lot of circulation. Time to follow up with some more data. As several commentators at CT noted, the death rate from assault in the U.S. is not uniform within the country. Unfortunately, state-level and county-level mortality data are not easily available for the time period covered by the previous post — though they do exist, going back to the 1940s. What I have to hand is a decade’s worth of US mortality data courtesy of CDC WONDERcovering 1999 to 2009. I extracted the assault deaths according to the same criteria the OECD uses (for the time period in question, ICD-10 codes X85-Y09 and Y87.1). The estimates are adjusted to the 2000 U.S. population, which isn’t identical to the standard OECD adjustment. But the basic comparability should be OK, for our purposes.

First, it’s well-known that there are strong regional differences in the assault death rate in the U.S. by state and region. Here’s what the patterns look like by state from 1999 to 2009 (click for a larger PNG or PDF):

This figure excludes the District of Columbia, which has a much higher death rate but is also a city. Also missing are a few states with small populations and low absolute numbers of assault deaths — Wyoming, North Dakota, Vermont — such that the CDC can’t generate reliable age-adjusted estimates for them. If you want a “small-multiple” view with each state shown separately from high to low, here you go.

The legend for the figure above arranges the states from high to low, reading top to bottom and left to right. Although it’s clear that geographical region isn’t everything, those tendencies are immediately apparent. Let’s look at them using the official census regions (click for a larger PNG or PDF):

As is well known, the South is more violent than the rest of the country, by some distance. Given the earlier post, the natural thing to do is to put these regional trends into the cross-national comparison and see — for the decade we have, anyway — how these large U.S. regions would fare if they were OECD countries. Again, bear in mind that the age-adjustment is not quite comparable (click for a larger PNG or PDF):

Despite their large differences, all of the U.S. regions have higher average rates of death from assault than any of the 24 OECD countries we looked at previously. The placid Northeast comes relatively close to the upper end of the most violent countries in our OECD group.

Finally, there’s the question of racial and ethic incidence of these deaths within the United States. Here are the decade’s trends broken out by the race of the victim, rather than by state or region (click for a larger PNG or PDF):

The story here is depressing. Blacks die from assault at more than three times the U.S. average, and between ten and twenty times OECD rates. In the 2000s the average rate of death from assault in the U.S. was about 5.7 per 100,000 but for whites it was 3.6 and for blacks it was over 20. Even 3.6 per 100,000 is still well above the OECD-24 average, which – if we exclude the U.S. – was about 1.1 deaths per 100,000 during the 2000s, with a maximum value of 2.9. An average value of 20 is just astronomical. And this is after a long period of decline in the death rate from assault.

—————————

Kieran Healy is a professor of sociology in the Kenan Institute for Ethics at Duke University.  His research is primary concerned with the moral order of a market society. You can follow him on twitter and at his blog.

Cross-posted at Kieran Healy’s blog.

The terrible events in Connecticut prompted me to update an old post about comparative death rates from assault across different societies. The following figures are from the OECD for deaths due to assault per 100,000 population from 1960 to the present.

As before, the most striking features of the data are (1) how much more violent the U.S. is than other OECD countries (except possibly Estonia and Mexico, not shown here), and (2) the degree of change — and recently, decline — there has been in the U.S. time series considered by itself. Note that “assault” as a cause of death does not distinguish the mechanism of death (gunshot, stabbing, etc). If anyone knows of a similar time series for gun-related deaths only, let me know.

(Click for a larger PNG or PDF.)

Here are the individual time series:

(Click for a larger PNG or PDF.)

—————————

Kieran Healy is a professor of sociology in the Kenan Institute for Ethics at Duke University.  His research is primary concerned with the moral order of a market society. You can follow him on twitter and at his blog.

Over at The Global Sociology Blog, SocProf put up some interesting visuals about social mobility, the likelihood that you have a significantly different economic status than your father.  Social mobility is important because it measures the degree to which a society has a caste system (in which you are restricted to the class you are born into, by whatever means) or one that gives people equal opportunities to ascend or descend the class hierarchy according to their hard work and talent.

Compared to similar countries, the U.S. has low social mobility (though most Americans think the opposite), along with Italy, the U.K., Chile, and Slovenia .  Scandinavian countries, Canada, and Australia have the most (see SocProf’s data here).

SocProf, however, asked a question I’ve never seen asked before: does this mobility differ by gender?  It does.  She found that daughters are more upwardly mobile than sons.

This first graph shows the percent of sons, born to a low-earning father, who will end up the top 40% of earners (orange) or the bottom 40% (blue).  Social mobility in the U.S. is lowest among the countries featured; almost 70% of American sons of low-earners stay in the bottom 40%.

The second graph is the same data for daughters.  Mobility for daughters is higher in all countries, but it is especially so in the U.S.  While 70% of sons stay in the bottom 40%, we can say the same for less than half of daughters.

Reflecting on the fact that the difference between daughters and sons was higher in the U.S. than in the comparison countries, SocProf suggests that “[g]reater mobility seems to go together with greater gender equality” in mobility.

See also this interactive graph mapping social mobility where you can see how you compare to the rest of the U.S.

Lisa Wade, PhD is an Associate Professor at Tulane University. She is the author of American Hookup, a book about college sexual culture; a textbook about gender; and a forthcoming introductory text: Terrible Magnificent Sociology. You can follow her on Twitter and Instagram.