
Cross-posted at Kieran Healy’s blog.
The chart in “America is a Violent Country” has been getting a lot of circulation. Time to follow up with some more data. As several commentators at CT noted, the death rate from assault in the U.S. is not uniform within the country. Unfortunately, state-level and county-level mortality data are not easily available for the time period covered by the previous post — though they do exist, going back to the 1940s. What I have to hand is a decade’s worth of US mortality data courtesy of CDC WONDERcovering 1999 to 2009. I extracted the assault deaths according to the same criteria the OECD uses (for the time period in question, ICD-10 codes X85-Y09 and Y87.1). The estimates are adjusted to the 2000 U.S. population, which isn’t identical to the standard OECD adjustment. But the basic comparability should be OK, for our purposes.
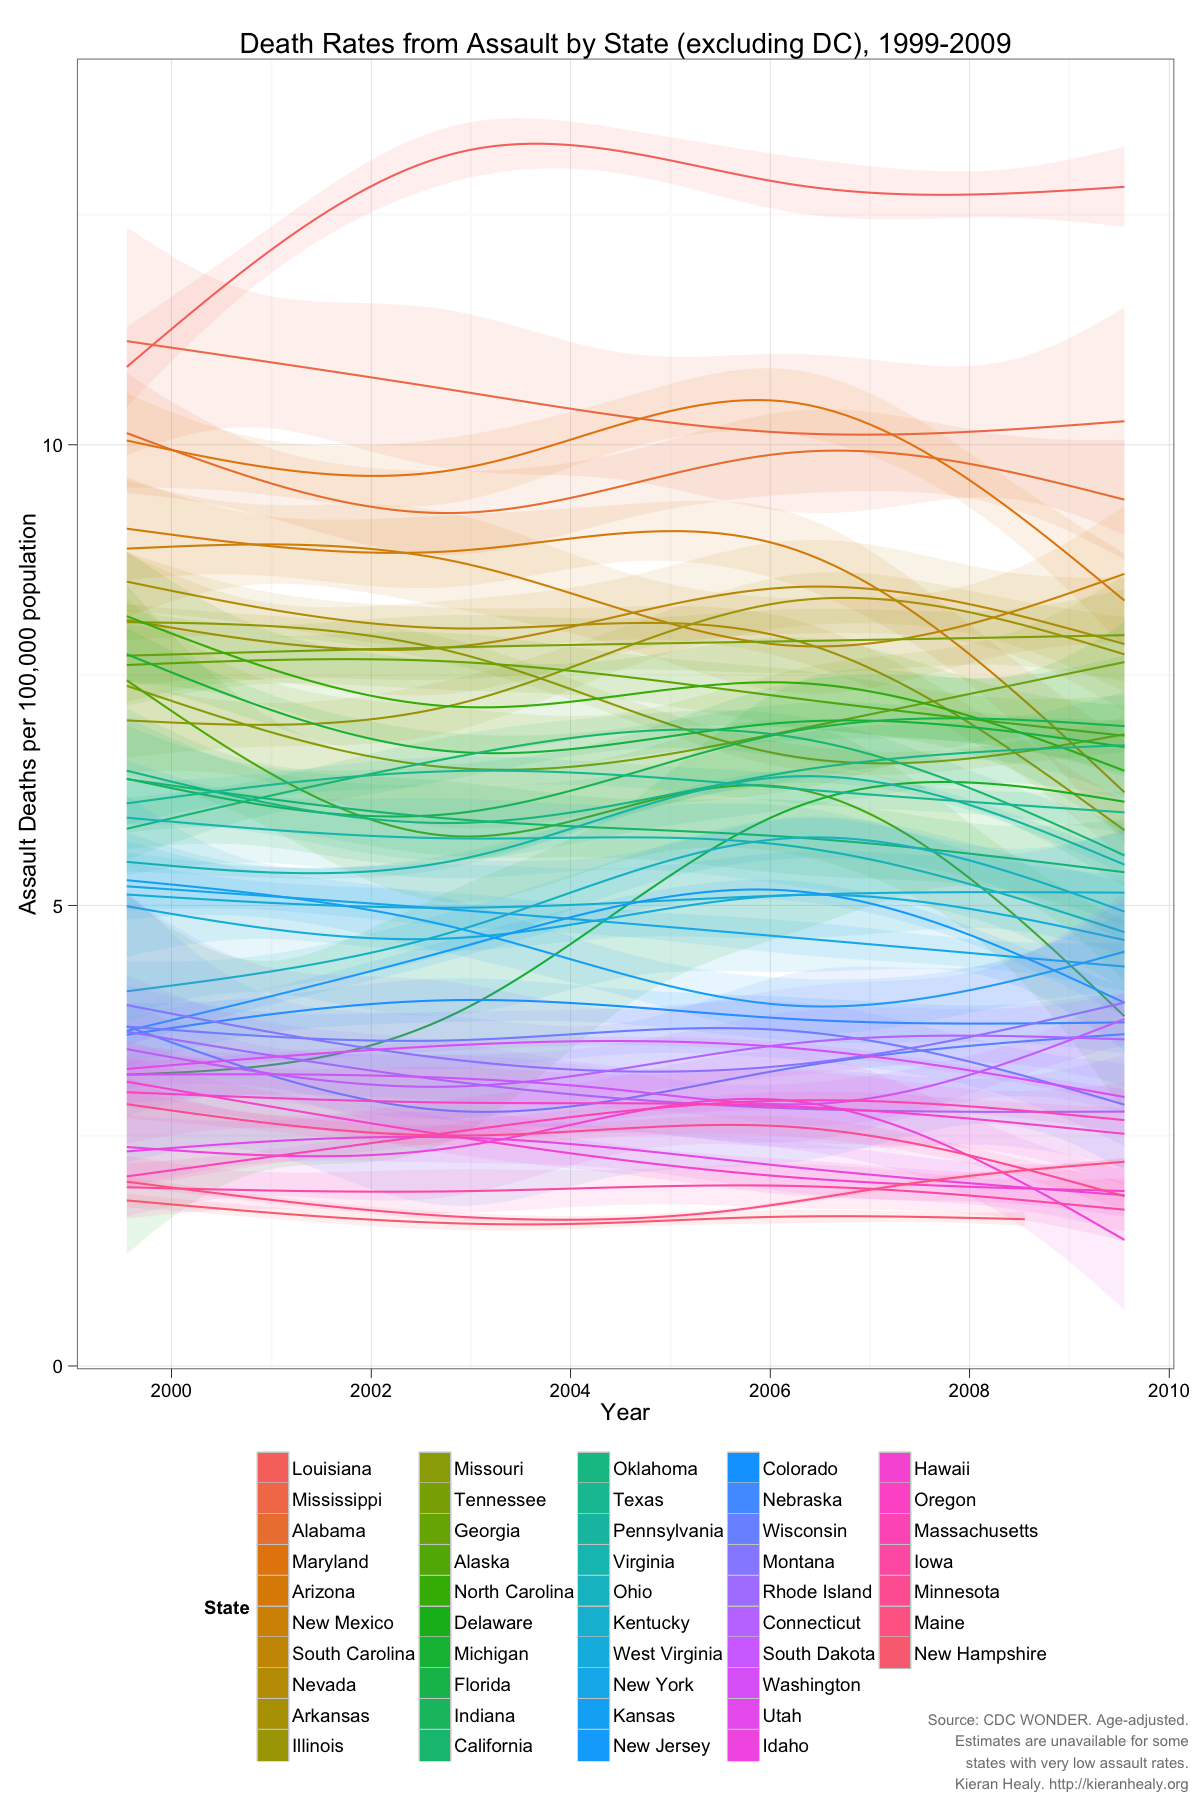
First, it’s well-known that there are strong regional differences in the assault death rate in the U.S. by state and region. Here’s what the patterns look like by state from 1999 to 2009 (click for a larger PNG or PDF):

This figure excludes the District of Columbia, which has a much higher death rate but is also a city. Also missing are a few states with small populations and low absolute numbers of assault deaths — Wyoming, North Dakota, Vermont — such that the CDC can’t generate reliable age-adjusted estimates for them. If you want a “small-multiple” view with each state shown separately from high to low, here you go.
The legend for the figure above arranges the states from high to low, reading top to bottom and left to right. Although it’s clear that geographical region isn’t everything, those tendencies are immediately apparent. Let’s look at them using the official census regions (click for a larger PNG or PDF):
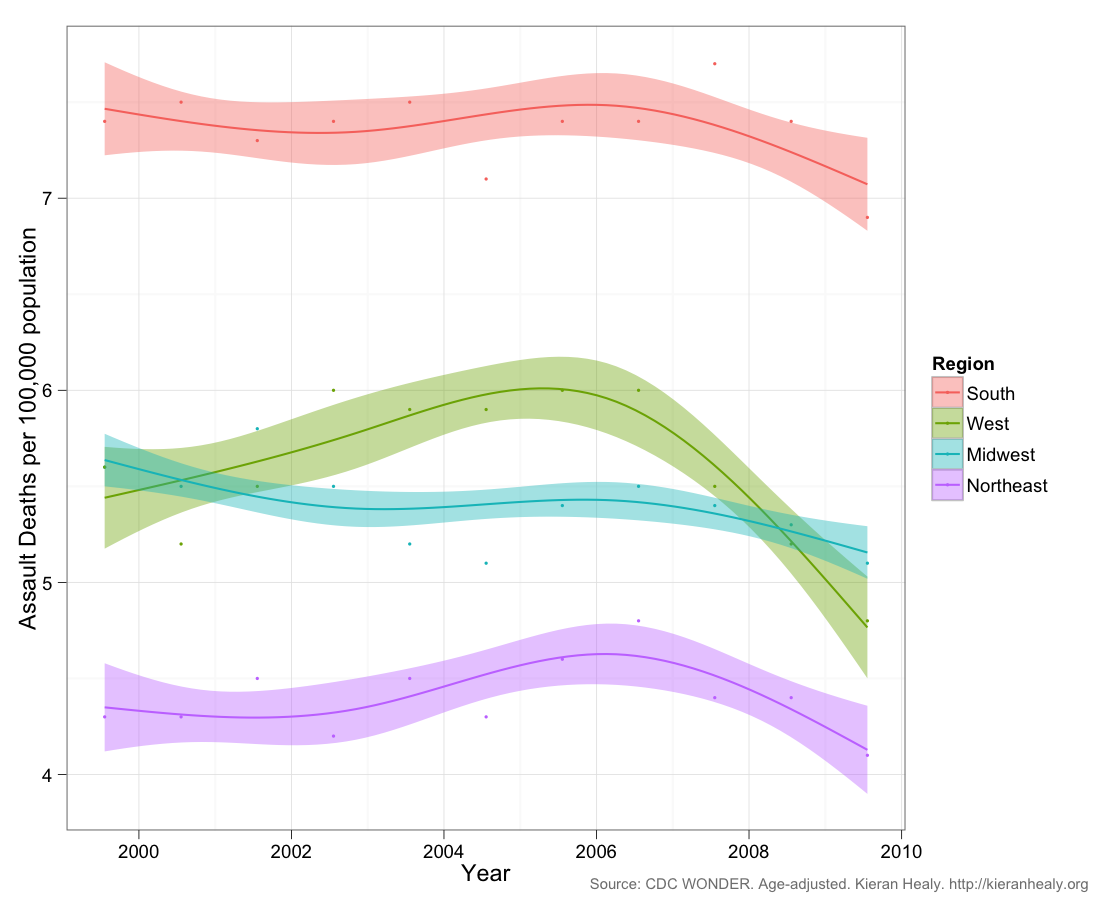
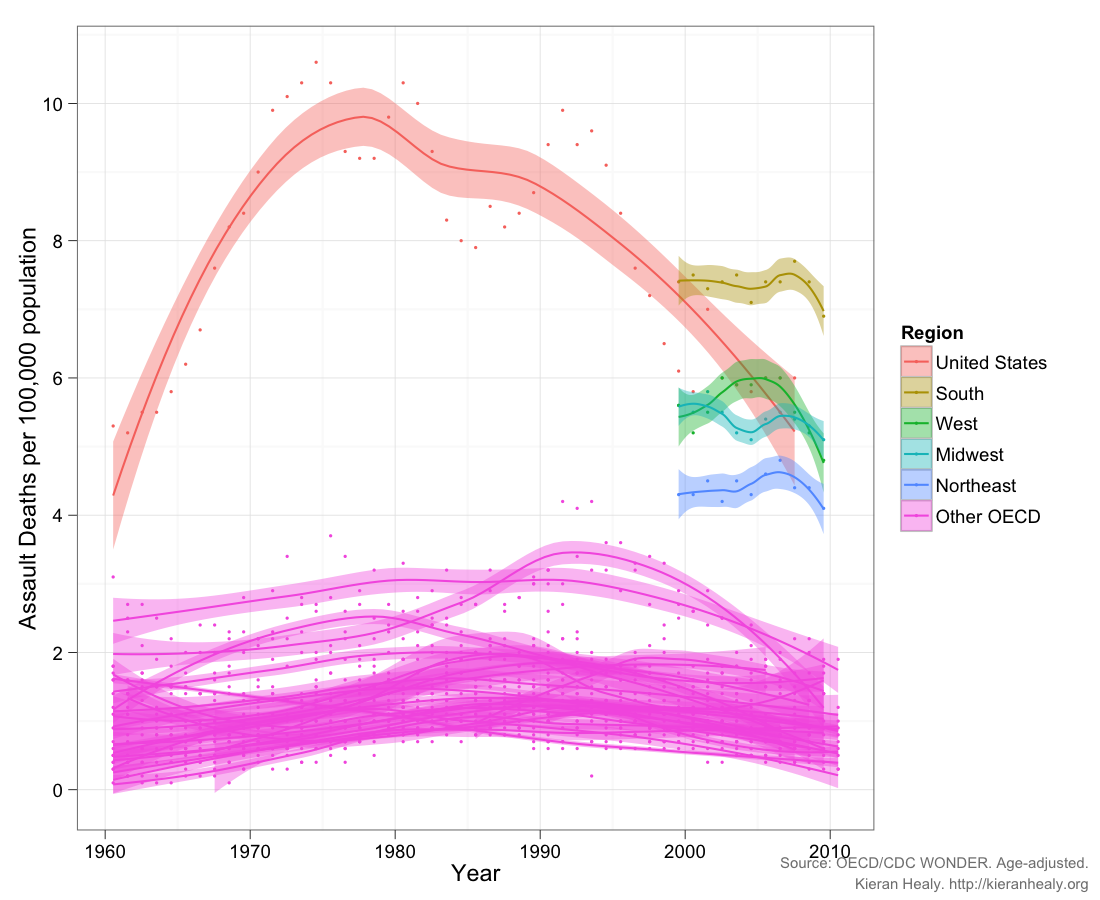
As is well known, the South is more violent than the rest of the country, by some distance. Given the earlier post, the natural thing to do is to put these regional trends into the cross-national comparison and see — for the decade we have, anyway — how these large U.S. regions would fare if they were OECD countries. Again, bear in mind that the age-adjustment is not quite comparable (click for a larger PNG or PDF):

Despite their large differences, all of the U.S. regions have higher average rates of death from assault than any of the 24 OECD countries we looked at previously. The placid Northeast comes relatively close to the upper end of the most violent countries in our OECD group.
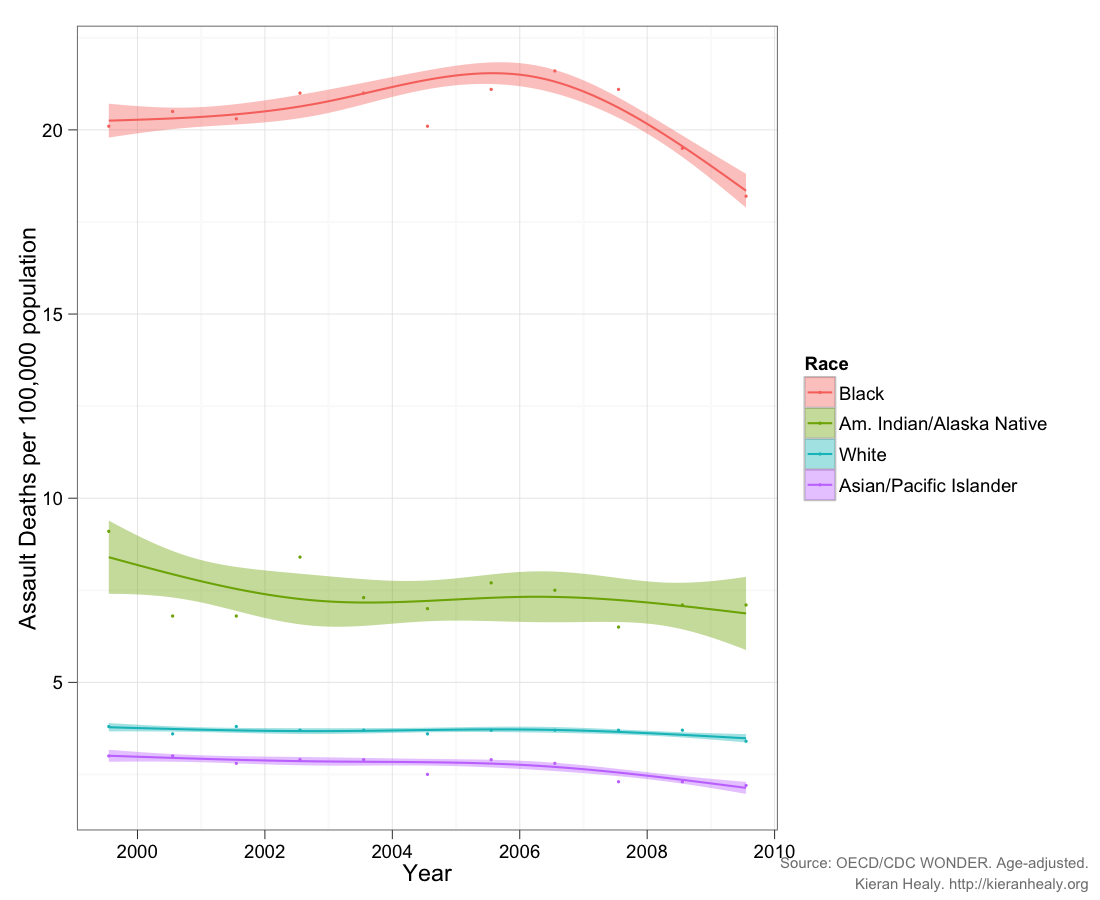
Finally, there’s the question of racial and ethic incidence of these deaths within the United States. Here are the decade’s trends broken out by the race of the victim, rather than by state or region (click for a larger PNG or PDF):

The story here is depressing. Blacks die from assault at more than three times the U.S. average, and between ten and twenty times OECD rates. In the 2000s the average rate of death from assault in the U.S. was about 5.7 per 100,000 but for whites it was 3.6 and for blacks it was over 20. Even 3.6 per 100,000 is still well above the OECD-24 average, which – if we exclude the U.S. – was about 1.1 deaths per 100,000 during the 2000s, with a maximum value of 2.9. An average value of 20 is just astronomical. And this is after a long period of decline in the death rate from assault.
—————————
Kieran Healy is a professor of sociology in the Kenan Institute for Ethics at Duke University. His research is primary concerned with the moral order of a market society. You can follow him on twitter and at his blog.
Comments 19
Leo — December 17, 2012
Great charts. Is the ggplot code available somewhere?
nathanargues — December 17, 2012
Are there any charts available co-relating these charts with gun ownership rates across states/regions/countries ?
decius — December 17, 2012
What is the process by which "age-adjusted" death rates are generated?
glaborous_immolate — December 17, 2012
So is most of OECD/US difference mostly black-driven? or do the absolute number of white victims overwhelm effect of the rate of black victims?
RudolfTheRedNoseReindeer — December 18, 2012
I'm sick of this gun crap. Where are all the Christmas posts?!
Ashby — December 19, 2012
I'd like to see that last chart broken out by region. How much of the regional variation is simply reflective of the racial weighting of the population of young men?
Assault Deaths Within the United States » Sociological Images « National-Express2011 — December 19, 2012
[...] on thesocietypages.org Sharen mit:TwitterFacebookGoogle +1TumblrPinterestEmailMoreLinkedInLike this:LikeBe the first to [...]
alienie — December 21, 2012
i want to share my happiness with the general public of what Therapist Oniha has done for me,in the last few weeks i was once in love this guy called brutty were in love with each other until he traveled out of my state for two years and we promise ourselves to be together forever, but before return from my journey he where now having another lover,when i try to come back to him. He told me i should go away,i love him so much that i could not let him go just like that,then i told a friend about it and she advice me and recommend this man Oniha for me when i visit him at winexbackspell@gmail.com he only ask me to buy some items for sacrifices to help me get my ex back and he actually did it and it work well and today i am happy with my beloved and forever lover,in-case anyone is out there with same problem or any kind i advice you to contact this man today at winexbackspell@gmail.com and with what he did for me i believe he can also help you
thank once again,please help me thank this great therapist.