immigration/citizenship

Cross-posted at Asian-Nation and Racialicious.

1
Photo by Lulu Vision (Flickr/Creative Commons)

As an undergraduate majoring in linguistics, I was fascinated with the concept of endangered languages. Colonization, genocide, globalization, and nation-building projects have killed off untold numbers of languages. As linguist K. David Harrison (my undergrad advisor) tells NPR, speakers of stigmatized or otherwise less-favored languages are pressured to abandon their native tongue for the dominant language of the nation and the market (emphasis mine):

The decision to give up one language or to abandon a language is not usually a free decision. It’s often coerced by politics, by market forces, by the educational system in a country, by a larger, more dominant group telling them that their language is backwards and obsolete and worthless.

These same pressures are at work in immigrant-receiving countries like the United States, where young immigrants and children of immigrants are quickly abandoning their parents’ language in favor of English.

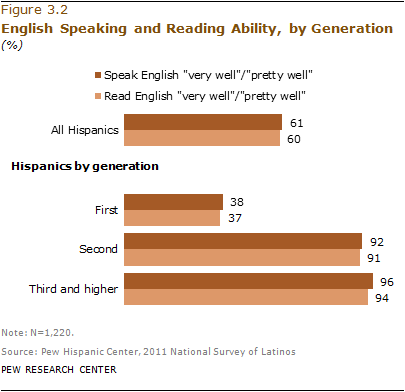
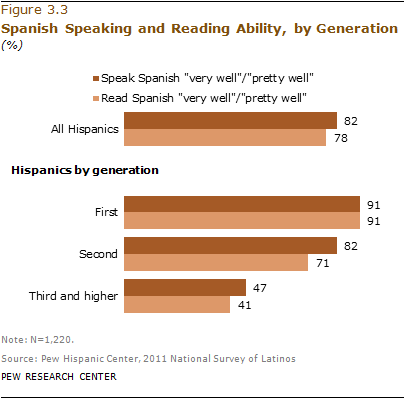
Immigrant languages in the United States generally do not survive beyond the second generation. In his study of European immigrants, Fishman (1965) found that the first generation uses the heritage language fluently and in all domains, while the second generation only speaks it with the first generation at home and in limited outside contexts. As English is now the language with which they are most comfortable, members of the second generation tend to speak English to their children, and their children have extremely limited abilities in their heritage language, if any. Later studies (López 1996 and Portes and Schauffler 1996 among them) have shown this three-generation trend in children of Latin American and Asian immigrants, as well.

The languages that most immigrants to the U.S. speak are hardly endangered. A second-generation Korean American might not speak Korean well, and will not be speaking that language to her children, but Korean is not going to disappear anytime soon — there are 66.3 million speakers (Ethnologue)! Compare that with the Chulym language of Siberia, which has less than 25.

Even if they’re not endangered per se, I would argue that they are in danger. While attitudes towards non-English languages in the U.S. seem to be improving, at least among wealthier and better educated people in some more diverse cities and suburbs, the stigma of speaking a non-English language still exists.

How many of you have:

  • been embarrassed to speak your heritage language in front of English speakers?
  • been reprimanded for speaking your heritage language in school?
  • been told to “go back to [country X]” when someone overhears you speak your heritage language?

I’ve heard innumerable stories about parents refusing to speak their native language to their children. Usually, the purported rationale is that they do not want the child to have language or learning difficulties, a claim that has been debunked over and over again by psychologists, linguists, and education scholars.

I’m sure that these parents truly believe that speaking only English to their children will give them an edge, though the reverse is true. What I wonder is how much this decision had to do with an unfounded belief about cognition and child development, and how much it had to do with avoiding the stigma of speaking a language that marks you as foreign, and as “backwards and obsolete and worthless”?

Calvin N. Ho is a graduate student in sociology at the University of California, Los Angeles studying immigration, race/ethnicity/nationalism, and Asian diasporas.  You can follow him at The Plaid Bag Connection and on Twitter.

In 2011 the U.S. birth rate dropped to the lowest ever recorded, according to preliminary data released by the National Center for Health Statistics and reported by Pew Social Trends:

The decline was led by foreign-born women, who’s birthrate dropped 14% between 2007 and 2010, compared to a 6% drop for U.S.-born women.

Considering the last two decades, birthrates for all racial/ethnic groups and both U.S.- and foreign-born women have been dropping, but the percent change is much larger among the foreign-born and all non-white groups.  The drop in the birthrate of foreign-born women is double that of U.S.-born and the drop in the birthrate of white women is often a fraction that of women of color.

It’s easy to forget that effective, reversible birth control was invented only about 50 years ago.  Birth control for married couples was illegal until 1965; legalization for single people would follow a few years later.  In the meantime, the second wave of feminism would give women the opportunity to enter well-paying, highly-regarded jobs, essentially giving women something rewarding to do other than/in addition to raise children.  The massive drop in the birthrate during the ’60s likely reflects these changes.

In addition to a drop in the number of children women are having, this data reflects a steady rise in the number of women deciding not to have children at all.  The decision to eschew parenting altogether is disproportionately high among highly educated women, suggesting that the there-are-now-other-things-in-life-to-do phenomenon might be at play.

Many European countries are facing less than replacement levels of fertility and scrambling to figure out what to do about it (the health of most economies in the developed world is predicated on population growth), the U.S. is likely not far behind.

Lisa Wade, PhD is an Associate Professor at Tulane University. She is the author of American Hookup, a book about college sexual culture; a textbook about gender; and a forthcoming introductory text: Terrible Magnificent Sociology. You can follow her on Twitter and Instagram.

For whatever reason, there has been a real slump in the number of people typing “obama gun” (will he take our guns away?), “obama muslim” (the idea used to run at about 20%), “obama socialist” (the republic “hangs in the balance“), and “obama citizen” (thank you, Snopes) into the Google search box since the 2008 election.

Here’s the Google trend (and the search link):

We don’t know how much these fears, versus other concerns, will affect votes against him this year, although there have been some good efforts to track the effects of anti-Black racism on his vote tally.

Naturally, not everyone who Googles these things believes the underlying stories or myths. But it seems likely they either believe them, are considering them, heard someone repeat them, or are arguing with someone who believes them, etc. So I’m guessing – just guessing – that these trends track those beliefs.

But maybe four years of Obama as an actual president has softened up the hard-line hatred in some quarters. What do you think?

Philip N. Cohen is a professor of sociology at the University of Maryland, College Park, and writes the blog Family Inequality. You can follow him on Twitter or Facebook.

The Russell Sage Foundation and the Stanford Center on Poverty and Inequality have put together Recession Trends, an interactive website that lets you create graphs about issues related to the recession. It takes a couple of steps to get to the database (you have to agree to the terms before entering), but once you’re there, you can choose data about a variety of topics — crime, housing, immigration, income, political attitudes, family life, and a lot more. It’s a great way to quickly get an overview of many aspects of life in the U.S.

I looked at the ratio of median family income between African American and White families. Between the early 1970s and 2010, we’ve seen a consistent gap in earnings, with Black median household income hovering between about 52 and 60% that of Whites:

The graph of the mean net worth of the individuals on Forbes’s list of the 400 richest people in the U.S. shows that while they certainly saw their wealth take a tumble during the recession — it fell to a mere $3.3 billion or so — they’re recovering well:

Unsurprisingly, the number of job seekers per job opening went up sharply after 2007; it’s finally starting to drop off slightly, though we still have about 5 people looking for every 1 job that’s available:

You can add more than one dataset for many topics. Here’s the growth in the prison population since 1980, by gender:

There’s lots, lots more. Whatever topic you’re particularly interested in, there’s a good chance there’s something there that’ll grab your attention for a bit.

Gwen Sharp is an associate professor of sociology at Nevada State College. You can follow her on Twitter at @gwensharpnv.

Last year I posted about a map several geographers put together showing the distribution of last names across the U.S. Historical immigration and internal settlement patterns are reflected in the concentrations of names across the country.

Now one of the geographers involved in that project, James Cheshire, has done the same for London. Using 2001 electoral rolls, Cheshire plotted the 15 most common surnames in 983 separate London districts. Here’s a section of the map of the most common name:

The size of the font is scaled to represent the number of people with each name. They’re color-coded by place or origin (though since many immigrants have Anglicized names, origin of a name may not reflect a person’s ancestry).

As Cheshire points out, a few names fill the top slot throughout most of London. As you go a bit further down the list, London’s diversity becomes more apparent. Here’s a small slice of the map of the 10th most common surnames:

Those of you with more knowledge of London, what noteworthy patterns do you see?

Scholars are busy attempting to predict the effects of climate change, including how it might harm people in some parts of the globe more than others.  A recent report by The Pacific Institute, sent in by Aneesa D., does a more fine-grained analysis, showing which Californians will be the most harmed by climate change.

They use a variety of measures for each Census tract to make a Vulnerability Index, including natural factors (like tree cover), demographic factors (like age), and economic factors (like income).  At the interactive map, you can see the details for each Census tract.  Their compiled index looks like this:

You can also see the Vulnerability Index for each measure individually.  Here is the data for the percent of people over age 65 who live alone, a variable we know increases the risk of death from heat wave.

And here’s the data for the percent of workers who labor outside:

There’s lots more data at the site, but what’s interesting here is that, even in incredibly wealthy parts of the world, climate change is going to have uneven effects.  When it does, the most vulnerable people in the more vulnerable parts of the state are going to migrate to the other parts.  Most Californians don’t imagine that their cities will be home to refugees, but this is exactly what will happen as parts of California become increasingly difficult to live in.

Lisa Wade, PhD is an Associate Professor at Tulane University. She is the author of American Hookup, a book about college sexual culture; a textbook about gender; and a forthcoming introductory text: Terrible Magnificent Sociology. You can follow her on Twitter and Instagram.

The Pew Hispanic Center has released a new report on trends in migration from Mexico. For the first time in 40 years, immigration from Mexico has slowed:

This is a notable change, as Mexican immigration has been the single largest immigrant flow to the U.S. form a single country, in overall numbers (though in the late 1800s, German and Irish immigrants made up a larger percent of all immigrants annually than Mexicans make up today). The report attributes this change to a range of factors, from changing economic conditions in Mexico, the recession’s effects on the U.S. economy, border enforcement, and the dangers of border crossings.

Indeed, we may now be seeing more people moving from the U.S. to Mexico than vice versa:

The change is due primarily to a drop in undocumented immigration, which peaked around 2007 and has dropped off significantly since:

There’s a lot more information available on changes in border enforcement and socio-economic changes in Mexico, so check out the full report.

In 1970, the U.S. Census added a “country of origin” question to its demographics section, which asks respondents if they are “of Hispanic, Latino, or Spanish origin.” But a new Pew Hispanic Center report indicates that, while these might be the official terms for those from Spanish-speaking countries and/or Latin America, they aren’t the preferred or most popular labels among those they’re supposed to identify. Only about 1 in 4 use the terms Hispanic or Latino most frequently to describe themselves:

Not surprisingly, identification with different labels differs among recent immigrants and those born in the U.S. Among the first generation, country of origin is the overwhelming preference, but by the third generation, just over 1 in 4 choose that as their most common self-identifier:

Most respondents had no preference between the terms Hispanic or Latino, but for those who did, Hispanic was more popular:

White was the most commonly-chosen racial identification:

Most respondents also said that while they think it’s important that Hispanics be able to speak Spanish in the U.S., that learning English is very important for success. By the second generation, almost all rate themselves as knowing English “pretty” or “very” well:

Conversely, among third-generation Hispanics, under half say they speak or read Spanish equally well:

Check out the full report for tons of additional information on identification, language use, etc.