gender: work

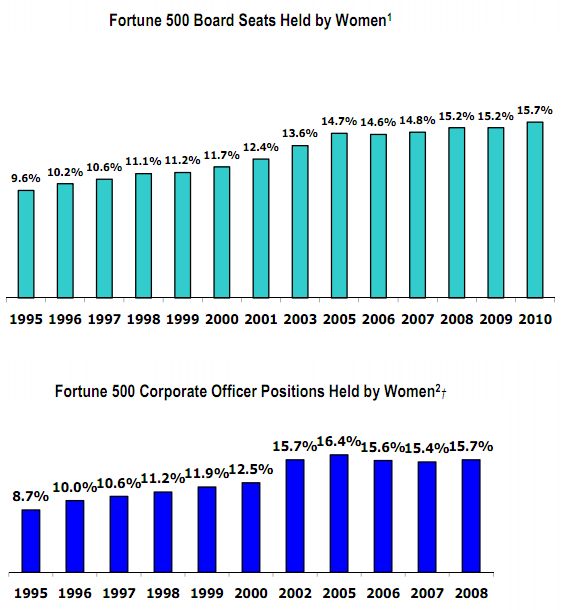
Going on 500 of you “liked” our recent post summarizing the statistical case against Walmart for gender discrimination.  A new Catalyst report, sent along by Washburn University Professor Sangyoub Park, reveals that Walmart isn’t alone in failing to promote women.  The study of Fortune 500 companies found that the percent of board seats and corporate officer positions held by women have been increasing, but not particularly quickly (source):

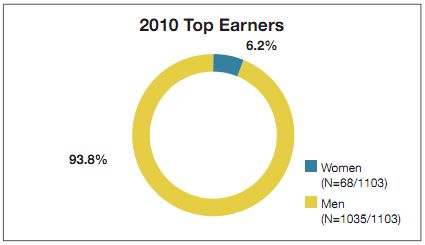
As of 2010, 18% of senior officers and 6% of their top earners were women (source):

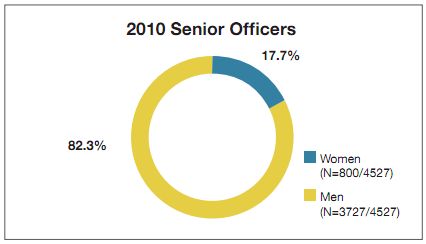
136 of the 500 companies had exactly zero female executives.

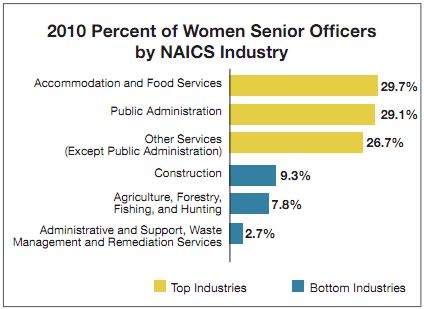
The data, however, actually varies quite tremendously by type of company (in a way that dovetails with general job segregation by sex):

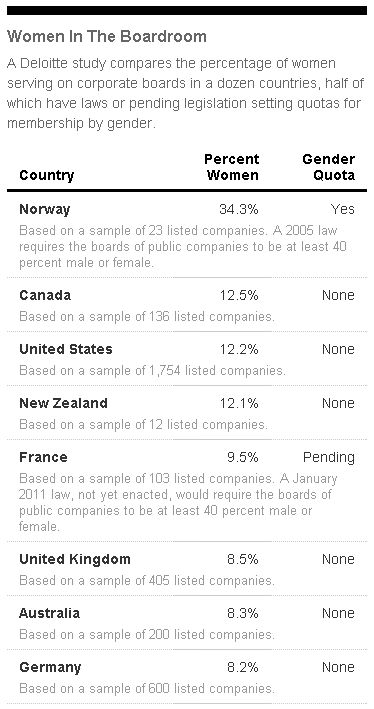
Data from the Deloitte Global Center for Corporate Governance, covered by NPR, reveal how the United States compares to other similar countries.  It shows that Europe is also struggling to achieve parity in the boardroom:

Lisa Wade, PhD is an Associate Professor at Tulane University. She is the author of American Hookup, a book about college sexual culture; a textbook about gender; and a forthcoming introductory text: Terrible Magnificent Sociology. You can follow her on Twitter and Instagram.

As a number of readers emailed us to point out, yesterday was International Women’s Day, designed to highlight both women’s accomplishments and the persistence of gender inequality worldwide. Ben Buursma noticed an ad in an Indonesian newspaper celebrating International Women’s Day and marketing “Books to empower all women,” though it turns out what they empower women to do is “look into the minds of men” and “find, keep, and understand a man”:

Emma M. H. sent in a link to the the White House Council on Women and Girls report on the status and well-being of U.S. women on a variety of social indicators. Interestingly, while both men and women are waiting longer to get married, the gender gap in age at first marriage has remained relatively constant for decades:

Men are more likely to be either married and never-married, while women currently more likely than men to be divorced or widowed:

Over time, the percent of women who have never given birth has gone up, particularly for the 25-29 age group, though in the last decade there has been a slight downward trend for women aged 30-44:

One note about that graph: the report uses the phrase “had a child” and “childbearing,” so I think this data would include women who have adopted children but never given birth.

I was surprised to see that rates of Cesarean sections have gone up in the past decade:

Women are now outperforming men in terms of educational attainment, earning the majority of bachelor’s degrees, though notice the number of degrees in engineering/computer science earned by women hasn’t increased since 1998:

However, women still make less than men at each level of educational attainment:

The report has lots more data on family life, work, education, health, crime, and so on. I’ll post on other topics in the future.

Finally, Ben N., Kay C., Gregory S., and Dave Z. all sent in this video starring Daniel Craig that highlights global gender inequality (though unfortunately I can’t find any reference that provides sources for the statistics in the video, so take it for what it’s worth):

Cross-Posted at BagNewsNotes.

We have posted in the past about how airlines use images of female flight attendants in ads to appeal to customers with promises of caretaking, eye candy, flirtation, and emotion work. Katrin sent in another example. This Cathay Pacific ad, which appeared in the U.K.,  presents Karina Yau, a flight attendant, to customers as the perfect caretaking woman — one who just wants to listen to you, not talk:

Notice also the passive stance — arms pulled into the body, her face turned away and eyes averted, hand fiddling with her coat sleeve. The text reads:

Karina went from fashion model to flight attendant — and still doesn’t think that life has had any real ups and downs. You can meet her and other members of the Cathay Pacific team at www.cathaypacific.co.uk. And while you’re there, check out our great fares to over 110 destinations worldwide. If you see Karina on your next flight, you might recommend a favourite book — she loves to read.

A post on the Cathay Pacific blog about Yau describes her as “modest.” At Cathay’s website you can “meet the team who go the extra mile to make you feel special.” It includes photos and bios of some employees, and I found Yau’s. The text they chose to highlight reinforces the emotion work she engages in for customers — “of course” she “smiled and apologised immediately.”

The ad and the features present customers with the promise of more than just a flight attendant who will do her job well. This flight attendant is the ideal of femininity: she’s beautiful (a former model), she’s submissive (apologizes immediately!), and she’s interested in you — your thoughts, your taste in books — whoever you are.

I wonder to what degree this draws on a specifically racialized femininity — the stereotypical depiction of Asian women as particularly submissive and docile. But since this ad ran in the U.K., I don’t know if that stereotype is as relevant. Readers, what say you?

Many of us are familiar with the female blue-collar workers that took jobs in factories during World War II. It turns out, however, that women were also employed as mathematicians and computers (that’s “compute-ers”). In this photo, Jean Jennings Bartik and Frances Bilas Spence get ready to present an early computer to military officials in 1946:

Women operating a “differential analyzer,” often checking the machine’s work by doing the math by hand:

Jean Jennings Bartik in 1946 with an early computer and Arthur Burks:

Their work was top-secret and so they weren’t part of the “Rosie the Riveter”-style propaganda at the time. Post-World War II disinterest in women’s accomplishments allowed their stories to remain untold.

A new documentary, forwarded to us by Jordan G. and Dmitriy T.M., reveals these high-tech Rosies:

Via BoingBoing, photos from CNN.

See also our post on the feminist mythology surrounding the iconic “Rosie the Riveter” image (hint: it was about class, not gender).  And you can buy Jean Jennings Bartik book, Pioneer Programmer, here.

Lisa Wade, PhD is an Associate Professor at Tulane University. She is the author of American Hookup, a book about college sexual culture; a textbook about gender; and a forthcoming introductory text: Terrible Magnificent Sociology. You can follow her on Twitter and Instagram.

Cross-posted at Ms.

Kelly V. suggested that I check out the book Traffic: Why We Drive the Way We Do (and What It Says about Us), by Tom Vanderbilt. The book is fascinating, covering everything from individual-level psychological and perceptual factors that affect our driving to system-level issues like why building additional roads often simply creates more traffic rather than alleviating it.

Among other things, it turns out that there are clear gender patterns in our driving; in particular, women do more driving as part of their family responsibilities. As Alan Pisarski, a traffic policy consultant, explains,

If you look at trip rates by male versus female, and look at that by size of family…the women’s trip rates vary tremendously by size of family. Men’s trip rates look as if they didn’t even know they had a family. The men’s trip rates are almost independent of family size. What it obviously says is that the mother’s the one doing all the hauling. (p. 135)

Nancy McGuckin and Yukiko Nakamoto looked at “trip chaining,” or making short stops on the way to or from work. They report that women tend to work closer to home (measured “as the crow flies,” or the great circle distance — GCD) than men in the same occupational categories (McGuckin and Nakamoto, p. 51)):

Research suggests a couple of possibilities for this pattern. Women, taking into account their family responsibilities, may look for closer jobs than men do so it will be easier to balance work and home life. It may also be that the types of jobs women are more likely to hold are more decentralized than men’s jobs and so more likely to be found closer to residential neighborhoods (although the graph above is broken down by occupational category, we see significant gender segregation in jobs within those broad categories).

Overall, men drive more total miles, and spend more time driving, per day, but women make more trips, particularly once they have children (p. 51):


Women are more likely to engage in trip chaining, and men and women differ in the types of stops they make. Men and women both stop to grab meals or coffee for themselves (in fact, the increase in these types of stops by men is so striking it earned a name, the “Starbucks effect”). However, more of the stops women make are to “serve passengers” — that is, going somewhere only because the passenger needs to, such as dropping a child off at school or childcare — or to complete shopping or family errands (p. 54):

Overall, 2.7 million men and 4.3 million women pick up or drop off (or both) a child during their work commute, according to federal data. Among households with two working parents who commute, women make 66% of the trips for drop offs/pick ups (p. 53)

This next graph isn’t related, but I’m throwing it in as a bonus. Sirkku Laapotti found that in both 1978 and 2001, men rated their own driving skills higher, on average, than women rated theirs…but both sexes thought they were way better drivers than people in 1978 did:

[Both papers are from Research on Women’s Issues in Transportation — Report of a Conference. Volume 2: Technical Papers. Conference Proceedings 35 (2005). Washington, D.C.: Transportation Research Board. The McGuckin and Nakamoto paper, “Differences in Trip Chaining by Men and Women,” is found on p. 49-56. Laapotti’s paper, “What Are Young Female Drivers Made Of? Differences in Driving Behavior and Attitudes of Young Women and Men in Finland,” is on p. 148-154.]

Cross-posted at Jezebel.

Kelsey C. sent in a graph from the Bureau of Labor Statistics that highlights the gender wage gap. Among full-time workers during the last three months of 2010, men made more per week than women in each of these occupational categories:

In terms of dollars, the gap is largest for the highest-paid workers — $330 — and smallest for those in sales/office, at $130. By percent, it’s worst for service (women make 72% as much as men in that sector) and again smallest for sales/office (women make 82% as much as men in that area).

And if we extrapolate this out, it adds up to a significant difference in annual earnings. If these income levels persisted for, say, 50 weeks, men in management would make $16,500 more than women; in sales, they’d make $6,500 more.

This is the only image the BLS provides, but if you’re interested in the topic, the full report has wages broken down by age and race/ethnicity (and sex within those categories) as well.

A polished version of this post was published in Contexts. You can download it here.

Most of our readers are probably familiar  with the now-iconic “We Can Do It!” poster associated with Rosie the Riveter and the movement of women into the paid industrial workforce during World War II:

It is, by this point, so recognizable that it is often parodied or appropriated for a variety of uses (including selling household cleaners). The image is widely seen as a symbol of women’s empowerment and a sign of major gender transformations that occurred during the 1940s.

In their article, “Visual Rhetoric Representing Rosie the Riveter: Myth and Misconception in J. Howard Miller’s ‘We Can Do It!’ Poster,” James Kimble and Lester Olson argue that our current interpretations of the poster don’t necessarily align with how it was seen at the time.

While the poster is often described as a government recruiting item (Kimble and Olson give many examples in the article of inaccurate attributions from a variety of sources), it was, in fact, created by J. Howard Miller as part of a series of posters for the Westinghouse Electric and Manufacturing Company — the Westinghouse logo is clearly visible just under the woman’s arm, and the badge on her shirt collar is the badge employees wore on the plant floor, including an employee number. The War Production Co-ordinating Committee was an internal Westinghouse committee, similar to those created by many companies during the war, not a government entity.

The assumption of current viewers of the image is usually that it was meant to recruit women into the workforce, or to rally women in general — an early example of girl power marketing, if you will — and was widely displayed. But the audience was actually only Westinghouse employees. The company commissioned artists to create posters to be hung in Westinghouse plants for specific periods of time; this poster specifically says, “Post Feb. 15 to Feb. 28” [1943] in small font on the lower left. There’s no evidence that it was ever made available to the public more broadly. For that matter, the poster doesn’t identify her as “Rosie,” and it’s not clear that at the time she would have been immediately identifiable to viewers as “Rosie the Riveter”.

The image that was more widely seen, and is often conflated with the “We Can Do It!” poster, was Norman Rockwell’s May 29, 1943, cover for the Saturday Evening Post:

Here, the woman is clearly linked to the idea of Rosie the Riveter, through both the name on her lunchbox and the  equipment she’s holding. She is more muscular than the woman in Miller’s poster, she’s dirty, and her foot is standing on a copy of Hitler’s Mein Kampf. Rockwell’s image presents the woman as a vital part of the war effort; her work helps defeat the Nazis. The image also includes fewer details to make her look conventionally attractive than Miller’s, where the woman has emphasized eyelashes and visibly painted fingernail.

Most interestingly, Kimble and Olson question the female empowerment message presumed to be the point of the “We Can Do It!” poster. We see the poster on its own, through the lens of a narrative about World War II in which housewives left the kitchen in droves to work in factories. But Westinghouse workers would have seen it in a different context, as one of a series of posters displayed in the plant, with similar imagery and text. When seen as just one in a series, rather than a unique image, Kimble and Olson argue that the collective “we” in “We can do it!” wouldn’t have been women, but Westinghouse employees, who were used to seeing such statements posted in employee-access-only areas of the plant.

Of course, having a woman represent a default factory employee is noteworthy. But our reading of the poster as a feminist emblem partially rests on the idea that this female worker is calling out encouragement to other women. The authors, however, point out a much less empowering interpretation if you think of the poster not in terms of feminism, but in terms of social class and labor relations:

…Westinghouse used “We Can Do It!” and Miller’s other posters to encourage women’s cooperation with the company’s relatively conservative concerns and values at a time when both labor organizing and communism were becoming active controversies for many workers… (p. 537)

…by addressing workers as “we,” the pronoun obfuscated sharp controversies within labor over communism, red-baiting, discrimination, and other heartfelt sources of divisiveness. (p. 550)

One of the major functions of corporate war committees was to manage labor and discourage any type of labor disputes that might disrupt production. From this perspective, images of happy workers expressing support for the war effort and/or workers’ abilities served as propaganda that encouraged workers to identify with one another and management as a team; “patriotism could be invoked to circumvent strikes and characterize workers’ unrest as un-American” (p. 562).

And, as Kimble and Olson illustrate, most of Miller’s posters included no women at all, and when they did, emphasized conventional femininity and the domestic sphere (such as a heavily made-up woman waving to her husband as he left for work).

Of course, today the “We Can Do It!” poster is seen as a feminist icon, adorning coffee cups, t-shirts, calendars, and refrigerator magnets (I have one). Kimble and Olson don’t explain when and how this shift occurred — when the image went from an obscure piece of corporate war-time propaganda, similar to many others, to a widely-recognized pop cultural image of female empowerment. But they make a convincing argument that our current perceptions of the image involve a significant amount of historical myth-making that helps to obscure the discrimination and opposition many women faced in the paid workforce even during the height of the war effort.

[The article appears in Rhetoric & Public Affairs 9(4): 533-570, 2006.]

Gwen Sharp is an associate professor of sociology at Nevada State College. You can follow her on Twitter at @gwensharpnv.

Dmitriy T.M. and Jeff H. sent in a link to Mapping the Measure of America, a website by the Social Science Research Council that provides an amazing amount of information about various measures of economic/human development in the U.S. Here’s a map showing median personal (not household) earnings in 2009:

The District of Columbia has the highest, at $40,342; the lowest is Arkansas, at $23,470 (if you go to their website, you can scroll over the bars on the left and it will list each state and its median income, or you can hover over a state).

You can break the data down by race and sex as well. Here’s median personal income for Native American women, specifically (apparently there is only sufficient data to report for a few states):

Native American women’s highest median income, in Washington ($22,181), is  lower than the overall median income in Arkansas, which is the lowest in the U.S. as we saw above.

Here is the percent of children under age 6 who live below the poverty line (for all races):

Life expectancy at birth differs by nearly 7 years between the lowest — 74.81 years in Mississippi — to the highest — 81.48 years in Hawaii:

It’s significantly lower for African American men, however, with a life expectancy of only 66.22 years in D.C. (again, several states had insufficient data):

The site has more information than I could ever fully discuss here (including crime rates, various health indicators, all types of educational attainment measures, commuting time, political participation, sex of elected officials, environmental pollutants, and on and on), and it’s fairly addictive searching different topics, looking data up by zip code to get an overview of a particular area, and so on. Have fun!