economics

American school children learn all about the U.S. gold rush in the Western part of the country. Goldmining was a speculative, but potentially highly rewarding endeavor and attracted, almost exclusively, adult men. But the entrepreneurship of gold mining (though not mining as wage work) is long gone in the U.S.  Still, gold is in high demand:  “The price of gold, which stood at $271 an ounce on September 10, 2001, hit $1,023 in March 2008, and it may surpass that threshold again” (source).  Who are the gold entrepreneurs today?  Where?  Under what economic conditions do they work?  And with what environmental impact?

I found hints to answers in a recent Boston.com slide show and a National Geographic article (thanks to Allison for her tip in the comments).  While there is still some gold mining in the U.S., there is gold mining, also, in developing countries and all kinds of people participate:

According to the United Nations Industrial Development Organization (UNIDO), there are between 10 million and 15 million so-called artisanal miners around the world, from Mongolia to Brazil. Employing crude methods that have hardly changed in centuries, they produce about 25 percent of the world’s gold and support a total of 100 million people…

Environmentally, gold is especially destructive.  The ratio of gold to earth moved is larger than in any other mining endeavor.

It makes me rethink whether I really want to buy gold (because, you know, I do that constantly, darling, constantly).  In fact, jewelry accounts for two-thirds of the demand.  In the comments, HP reminds me:

Gold (along with even more problematic metals) is found in pretty much all consumer electronics. It’s in your computer, your cellphone, your .mp3 player, your TV/stereo, etc. You’re buying gold all the time already, whether you know it or not.

UPDATE! A reader, Heather Leila, linked to a picture she took of gold prospecting in Suriname (at her own blog).  She writes:

The gold mines aren’t what you are thinking. They aren’t underground, you don’t carry a pick axe and a helmet. The garimpos are where the miners have dammed a creek and created large mud pits. The mud is pumped through a long pipe lined with mercury. The mercury attaches itself to the specks of gold and gets filtered out as the mud is poured into a different pit. The mercury is then burned off, while the gold remains. This is how it was explained to me. From the plane, they are exposed patches of yellow earth dotting the endless forest.

See also our posts on post-oil boom life and gorgeous photos of resource extraction by Edward Burtynsky.

Lisa Wade, PhD is an Associate Professor at Tulane University. She is the author of American Hookup, a book about college sexual culture; a textbook about gender; and a forthcoming introductory text: Terrible Magnificent Sociology. You can follow her on Twitter and Instagram.

This week the Supreme Court overturned a ban that “prevented corporations [and unions] from using their profits to buy political campaign ads” (source).  The ruling enhances the ability of these organizations to throw money behind candidates, potentially increasing their ability to influence political decision-making by shaping who ends up in, and out of, office.  The majority argued that the decision honored the First Amendment right to free speech.  And, since corporations, according to U.S. law, are persons, they have the same right to free speech as any of us.

They also, of course, happen to have a lot more money.

So much money, Senator Charles Schumer (D – New York) said, that “…the winners of next November’s election. It won’t be the Republican or the Democrats and it won’t be the American people; it will be corporate America” (source).

Matthew Yglesias puts this in perspective (source):

Bank of America, for example, dedicates $2.3 billion to marketing in 2008 so it’s clear that they’ve got the budget to mount a $100 million series of scathing attacks on a Senator who pisses them off and basically laugh that off (and note that in 2004 total spending on Senate campaigns was just $400 million). And if you can have it be the case that just one Senator goes down to defeat for having pissed off BofA then everyone else will learn the lesson and avoid pissing them off in the future. You don’t need to actually sustain that volume of campaign spending.

Others argue that the ruling doesn’t so much change the political landscape as make it more honest, since corporations have always found ways around the rules anyway (source):

“Whether there’s a vast increase in the amount of resources spent, it’s hard to say,” said Joseph Sandler, a former lawyer for the Democratic National Committee. “There’s already so much they can do.”

Republican consultants, in particular, argued that the decision would simply shift spending by political action committees and issue-based “front groups” to the corporations themselves.

“I don’t believe that the ruling will fundamentally change the outcome of the elections given the obscene amounts of money that was spent independently in the last two years by everyone,” said Jim Innocenzi, a GOP strategist in Alexandria, Va. “You could argue that since everyone has figured out a way to get around the rules, we’d be better off with full disclosures of who is really paying for this stuff and let everyone just promote whatever cause they want.”

The decision left unaddressed the question of whether this meant that multinational corporations, with non-U.S. roots and branches, were allowed to throw money to candidates (source).  Right now, the answer appears to be “yes.”  This, then, allows for an unprecedented “foreign” influence on U.S. elections.

So, with all  that said:  How do unions and corporations spend their money in elections?  What can we expect?

Dmitriy T.M. sent in a link to the Center for Responsive Politics listing the 100 corporations with the largest contributions to political campaigns between 1989 and 2009, as well as the direction of their donations (to the left or right).  Donations include:

Direct “soft money” contributions from the organization’s treasury. Under federal law, contributions from the treasuries of corporations, unions or other organizations may only be given to the parties’ “non-federal” (soft money) committees.

Contributions from the organization’s political action committee, or PAC. The money for these comes from individuals who work for or are connected with the organization, and it’s given on behalf of the organization.

Contributions by individuals connected with the organization. This includes employees, officers, and members of their immediate families.

Here are the results:

At last as far as these top 100 are concerned, it doesn’t appear that there is an overwhelming preference for Republicans, as one might expect.  Then again, a lot of these are unions.

But what does it mean when corporations and unions are sitting “on the fence”?  Basically it means that they’re covering their bases.  They win influence whether Republicans or Democrats end up in office.  Interestingly, 46 of the 100 are on the fence.  This doesn’t mean that things are somehow more fair or balanced, it means that, no matter who wins, corporations and unions win.

For another look at this type of information, see our post on partisan political contributions by U.S. companies.

Lisa Wade, PhD is an Associate Professor at Tulane University. She is the author of American Hookup, a book about college sexual culture; a textbook about gender; and a forthcoming introductory text: Terrible Magnificent Sociology. You can follow her on Twitter and Instagram.

Dan S. forwarded a post by Matthew Yglesias in which he presents recent data from the OECD Factbook (larger version at the link).  It is another interesting way to think about income inequality.

First, we can look at a comparison of how much median income earners in the U.S. make compared to other countries (in U.S. dollars).  Luxembourg is the standout at the far right, with the U.S. not far behind, showing the fourth highest median income alongside some Scandinavian countries.  Mexico, Turkey and some Eastern European countries have the lowest median incomes.

A story starts to emerge, however, if we look at the median income of the bottom 10% of earners.  Suddenly the relative position of the U.S. shifts way to the left; the bottom 10% of earners in the U.S. make less than the OECD average.  Notice that the relative placements of the other high income and low income states don’t shift very much.  This means that while people in the U.S. are doing relatively well overall, the poorest people in the U.S. are doing worse than the poorest in about 2/3rds of the other countries:

Then, if you look at the median income of the top 10%, the relative position of the U.S. moves all the way to the right; that is, the top 10% of U.S. earners make more than the top 10% of earners in any other OECD country.  We even beat out Luxembourg:

Most other countries retain their relative position, more or less, with the exception of Sweden, which drops way down.  So the richest Swedes are, relatively speaking, not that rich.

The lesson is that income inequality–the difference between the incomes of the high earners and low earners–is significantly more severe in the U.S. than it is in other OECD countries (and that may be an understatement).

See this post for another graphic showing that income inequality is larger in the U.S. than in most other industrialized countries.  Also, the top 1/100th of a percent in the U.S. brings home a larger proportion of the total earned income in 2007 than they have since 1913.  And here is the percent of total U.S. income that went to the top 1% of earners (23% as of 2006).  Also see our posts breaking down CEO compensation, on the disproportionate tax burden by social class, and on class inequality across U.S. states.

Lisa Wade, PhD is an Associate Professor at Tulane University. She is the author of American Hookup, a book about college sexual culture; a textbook about gender; and a forthcoming introductory text: Terrible Magnificent Sociology. You can follow her on Twitter and Instagram.

Greg Mankiw, a big shot economist (he was the chairman of President Bush’s Council of Economic Advisors) had a brief blog post on Monday comparing European countries and the US. It’s part of a long-standing debate about the relative merits of European-style social democracy. The left wants the US goverment to do more to reduce inequalities (ensuring universal health care, for example, or providing benefits for the unemployed, and the poor, requiring employers to offer paid maternity leave, etc.). Those on the right argue that these policies would stifle the economy. They offer an economic picture of America the dynamic, Europe the stagnant.

The volume on that debate got turned up by an article by Jim Manzi in National Affairs. He refers to “government policies — to reduce inequality or ensure access to jobs, education, housing, or health care — that can in turn undercut growth and prosperity.”

Paul Krugman, in his column on Monday, rejected this idea:

The real lesson from Europe is actually the opposite of what conservatives claim: Europe is an economic success, and that success shows that social democracy works.

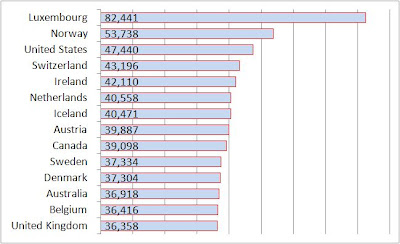
Greg Mankiw gives some data on GDP per capita, adding with a sly grin, “Readers of today’s column by Paul Krugman might find these figures useful to keep in mind.” He gives the data for “the United States and the five most populous countries in Western Europe.”

We’re number one. We’re way ahead – 30% higher than the UK next in line. Mankiw wins; Krugman loses. Case closed. Or is it?

I’m sure there’s a good economic reason for this cherry-picking choosing only the five largest cherries. But if you were curious about some of the insignificant countries in Europe and elsewhere, you might want to take a look at the entire list. Here’s an expanded chart:

It turns out that among the non-Asian industrial democracies, there are a few countries that fall in that $11,000 gap between the US and UK. And when you include all those countries, the US is no longer number one.

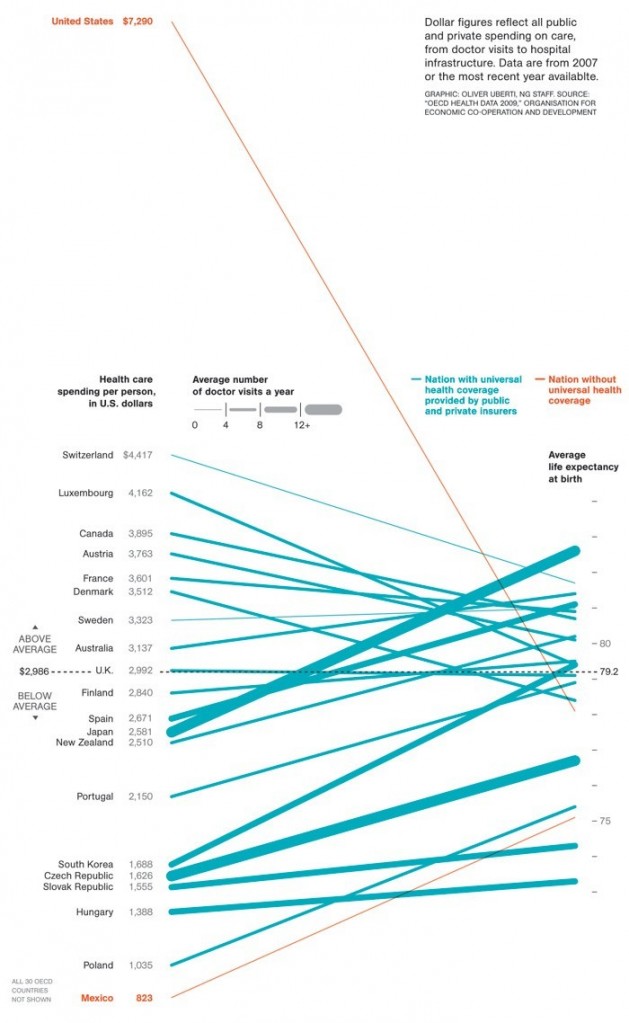
The figure below, sent in by Muriel M.M. and Josh P., shows the relationship between health care spending (on the left) and life expectancy (on the right). Perhaps the most stunning finding is what appears to be a rather loose correlation between the two. But a second finding is the inefficiency of U.S. spending (see it at the left top of the figure?): it is far above the other states included and is, nonetheless, translating into less-than-stellar results (if you measure by life expectancy).

6a00e0098226918833012876674340970c-800wi

Via National Geographic.

Lisa Wade, PhD is an Associate Professor at Tulane University. She is the author of American Hookup, a book about college sexual culture; a textbook about gender; and a forthcoming introductory text: Terrible Magnificent Sociology. You can follow her on Twitter and Instagram.


Binyavanga Wainaina does an excellent job, in this 3-minute video, describing ways that “Africa” tends to be written about in the West. See how many of the tropes you recognize:

To paraphrase Jose, at Thick Culture, it’s important to be engaged with the world, but our engagement shouldn’t be entirely on our terms. And, especially, not terms in which the Western world gets to construct itself as the savior of the less fortunate (e.g., Avatar).

Such ideas make it seem as if underdeveloped parts of the world are somehow inherently deficient (culturally or otherwise). When, in fact, insofar as underdeveloped parts of Africa or other continents need saving, it is partly (largely?) because of (1) a history of colonialism that stole their resources and disrupted their societies and (2) the current global economic system that continues to put them at a devastating disadvantage.

See also: The Single Story of “Africa”

Lisa Wade, PhD is an Associate Professor at Tulane University. She is the author of American Hookup, a book about college sexual culture; a textbook about gender; and a forthcoming introductory text: Terrible Magnificent Sociology. You can follow her on Twitter and Instagram.

Please welcome Guest Blogger Philip Cohen.  Cohen is a sociology professor at the University of North Carolina at Chapel Hill where he specializes in studying the family.  We are pleased to reproduce a post from his own blog, Family Inequality, about (how statistics lie and) the recent media hype about the decrease in the divorce rate.

—————————————-

Delivering some “good news for Christmas,” The National Marriage Project, under the editorship of the sociologist W. Bradford Wilcox, has released a report titled The State of Our Unions, 2009: Money and Marriage. It has a lot of useful information on marriage and families, with some editorial bending in the pro-marriage-and-family direction.

My beef here is with the chapter titled “The Great Recession’s Silver Lining?” In it, Wilcox writes:

judging by divorce trends, many couples appear to be developing a new appreciation for the economic and social support that marriage can provide in tough times. Thus, one piece of good news emerging from the last two years is that marital stability is up.

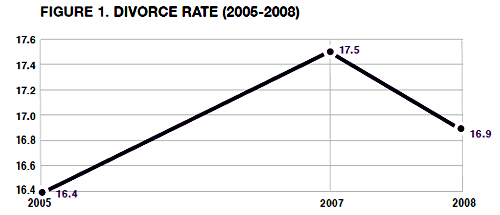
That line was quoted by Ross Douthat at the New York Times, which is a shame, because there is no evidence about anyone’s appreciation for marriage in the chapter. Instead, the evidence for this assertion is presented in a graph that shows three data points in the divorce-rate trend:

The figure shows a decline in the divorce rate from 2007 to 2008. In the press release he calls that drop “the first annual dip since 2005.” (The rate shown here is divorces in a given year per 1,000 married women in the population that year.) Couple things:

1. There is no data point for 2006, so for all we know the divorce rate actually rose higher than it was in 2007, and started falling before the recession, which officially began in December 2007.

2. Despite the dramatic turnaround apparent in this graph, it’s really not enough to go on to draw the kind of conclusion he draws.

The second point is more important, because there really is a lot of research that shows job loss increases the odds of divorce. So why should this recession be different? It’s possible it is, but there’s no evidence – in this report or elsewhere that I’ve seen – of such a change.

In fairness, Wilcox wrote a column in the Wall Street Journal that musters some anecdotal evidence for his theory. But nothing to get him this far: “For most married Americans, the Great Recession seems to be solidifying, not eroding, the marital bond.” Even if the divorce did drop a little in one year – that doesn’t say anything about “most married Americans.”

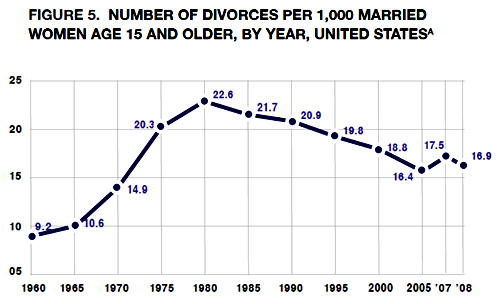
That three-point graph is especially unfortunate because it leads to interpretations like this: “The divorce rate … had previously been on an upward path, rising from 16.4 divorces per 1,000 married women in 2005 to 17.5 in 2007.” That seriously misstates the real trend in divorce rates, which have actually been falling since 1981. And there is nothing in the trend to suggest that recessions teach couples a “new appreciation for the economic and social support that marriage can provide in tough times.” In the appendix, Wilcox presents that longer trend, which makes his previous figure seem much less dramatic.

(The graph seems a little off to me – notice how 10.6 is closer to the line for 10 than 14.9 is to the line for 15 – but I’ll work from his numbers below anyway.)

I think the story of a turnaround in divorce rates has traction because, like crime, divorce is one of those things many people assume is always getting worse (I see this in student papers frequently). So any decline in divorce rates looks like an important change.

What is recession’s effect?

I previously speculated that, because this recession was costing so many men their jobs, more men were likely to be become primary caregivers, and do more housework. The downside – I speculated – was that “maybe men getting ’stuck’ with childcare doesn’t bode well for marriages.” To support that speculation, I showed a graph of divorce rates that had little upward spikes during some recent recessions. The graph was not the real evidence for the argument – which was here:

We already know that economic hard times contribute to marital instability and divorce. Studyafter study after study have found that losing a job increases the likelihood of divorce, with some evidence that husbands’ losses matter more.

Here is a new graph I made, with the “crude divorce rate” (divorces per 1,000 people in the population) in blue, superimposed over Wilcox’s calculations in red. (His takes more work, which is probably why he doesn’t have it for every year. But they track quite well, with some pulling apart some after 1980, which has to do with changes in the population composition that probably aren’t important.) I also put the recessions on there, roughly, by hand with purple bars.

Source: Divorce rates from 2010 Statistical Abstract and various prior years; business cycles from 2010 Statistical Abstract.

Two things here:

1. Over the longer run, there is no obvious relationship between recessions and the divorce rate. There are big social forces at work here (like the rise of the legal practice of no-fault divorce, the increase in women’s education and employment, the growing tendency of men and women of similar education levels to marry, later age at marriage, more cohabitation and unmarried childbearing, etc.). But on the surface – which is where the Wilcox conclusion is drawn – there is not much to go on.

2. The crude divorce rate I got from the Statistical Abstracts shows a little peak in 2006 – not 2007 – followed by two consecutive years of decline, beginning before the recession. So rather than talk about the reason for the decline in the last year – which really just fits in with the falling divorce rates since 1981 – the anomaly is 2006. I have no explanation for that, but in the long run it probably doesn’t matter much.

On the other hand, the American Academy of Matrimonial Lawyers has surveyed its members twice since the recession started. In the first release last fall, they said 37% expected a drop in divorce filings, compared with 19% who usually see an increase during recessions. This fall they report that 57% of their members experienced a drop in filings, with just 14% seeing an increase. There are no details or methods reported in these releases, so it’s hard to evaluate. But if it’s true – along with the previous evidence that unemployment increases divorce – then it maybe that recessions delay the timing of divorce filings while increasing the divorce rate for those affected in the long run.

On the third hand, Jay Livingston at Montclair State points out that the NY Times reports that, in New York’s recession-year court backlog,  ”Cases involving charges like assault by family members were up 18 percent statewide.”

Whether delayed divorce filings contribute to family violence is a question someone might be able to answer when they put all this together. But I doubt the final word will end up as simple as, “Couples too broke to bicker,” as heartwarming as that is. There may be something to the speculation that falling home prices are stalling some divorce plans, but that is not quite the same as developing a newfound appreciation for the benefits of marriage.

I’m sticking with this: in hard times, families are a big part of how people make it through, but hard times are also hard for a lot of marriages. If it’s true that the husband’s job loss especially increases stress on a marriage – as previous research suggests – we may yet see that emerge for the current crisis. If not, maybe something has changed.

Lisa Wade, PhD is an Associate Professor at Tulane University. She is the author of American Hookup, a book about college sexual culture; a textbook about gender; and a forthcoming introductory text: Terrible Magnificent Sociology. You can follow her on Twitter and Instagram.

Missives from Marx sent in a link to this animated time line documenting the diffusion of various political-economic systems (e.g., fascism, democracy, and feudalism) over world history.  It can be read as a story about the triumph of democracy, but it’s also illustrates how political-economic systems are not natural, but invented during particular historical eras, and diffuse or disappear as a consequence of war, geography, and other geopolitical factors.

Lisa Wade, PhD is an Associate Professor at Tulane University. She is the author of American Hookup, a book about college sexual culture; a textbook about gender; and a forthcoming introductory text: Terrible Magnificent Sociology. You can follow her on Twitter and Instagram.