economics

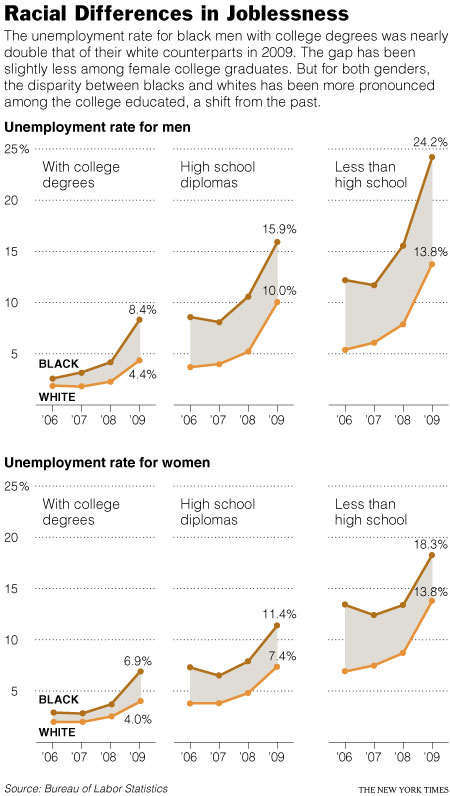
This week the New York Times featured a story about joblessness rates among black and white men and women.   As the figures below show, black men and women always face higher levels of unemployment compared to whites of the same education level; for men, the disparity increases as education level increases; and for black women, that pattern holds at least for 2009.

popup

For more detailed data on this phenomenon, see our posts on race and the economic downturn, the intersection of race and criminal record, and education and unemployment.

Lisa Wade, PhD is an Associate Professor at Tulane University. She is the author of American Hookup, a book about college sexual culture; a textbook about gender; and a forthcoming introductory text: Terrible Magnificent Sociology. You can follow her on Twitter and Instagram.

This graphic reveals which states pay the most in federal taxes and which receive the most in return. At the very bottom of the graphic, you can see the ratio of taxes out and taxes in. Rhode Island is exactly even, while the states above and to the left are essentially “donation” states and the states below and to the right are “welfare” states:

tax

Found at Visual Economics, via ChartPorn.

Lisa Wade, PhD is an Associate Professor at Tulane University. She is the author of American Hookup, a book about college sexual culture; a textbook about gender; and a forthcoming introductory text: Terrible Magnificent Sociology. You can follow her on Twitter and Instagram.

Carolyn Steel answer this question with a long range view (and lots of fascinating information), and points out the problems in our supply chain, in this TED video:

Lisa Wade, PhD is an Associate Professor at Tulane University. She is the author of American Hookup, a book about college sexual culture; a textbook about gender; and a forthcoming introductory text: Terrible Magnificent Sociology. You can follow her on Twitter and Instagram.

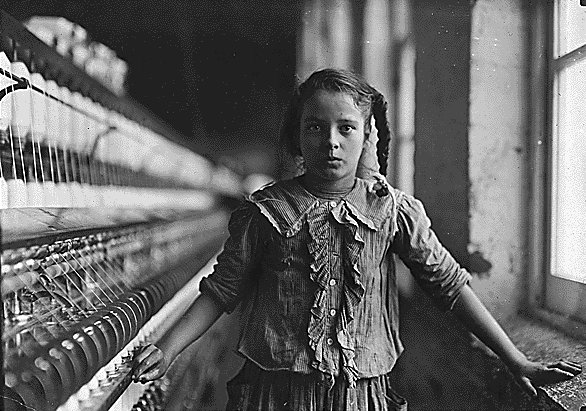
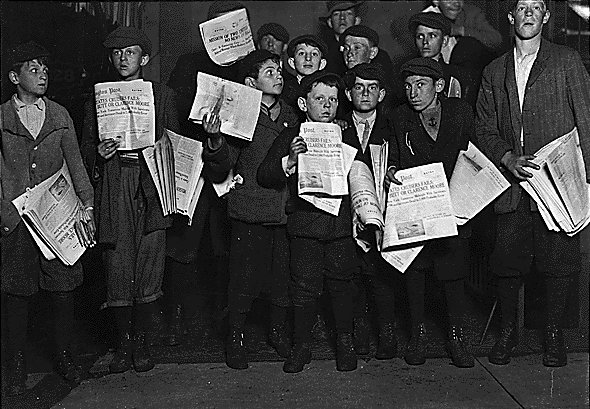
These days the talk is about adult-olescence, or the seeming extention of adolescence well into ones twenties.  But the idea that children should have a childhood at all is actually pretty recent.  Before industrialization, when families tended to work their own land, children got to work as soon as they were able.  Being apprentices to their parents was the difference between life and death.

Industrialization brought a whole new kind of work: wage work that occurred outside the home.  At that time, it made perfect sense that kids would work, as they’d be working on the farm all along.  Only later did we decide that working outside the home was different than working at it and that, perhaps, children working outside of the home needed protection.  The first federal law regulating child labor was passed in 1938.

Below are some amazing photographs of child laborers from The History Place (thanks to Missives From Marx for pointing me to them).

The Spinning Factory:

view

empty

whitnel

full

Newsies:

n1

n2

n3

n4

Miners:

c1

c2

c3

Factory Workers:

f1

f2

f3

f4

Seafood Workers:

d1

d2

d3

d4

Fruit Pickers:
q1

q2

Misc.:

z1

z2

z3

Lisa Wade, PhD is an Associate Professor at Tulane University. She is the author of American Hookup, a book about college sexual culture; a textbook about gender; and a forthcoming introductory text: Terrible Magnificent Sociology. You can follow her on Twitter and Instagram.

When we consider how well we are doing financially, we must choose a referent.  That is, when we ask the question (“How well am I doing?”), we are also, simultaneously choosing a comparison group (e.g., people in our profession, people of our same sex, people our age, etc).

Most of us probably also restrict our considerations to people in the same country.  We usually don’t think about how well we are doing compared to all human beings in the world, but this website allows us to do just that.  If you put in your yearly income, it will show you where you rank on a global scale (Yen, Canadian dollars, U.S. dollars, Euros, and Pounds only, unfortunately).

I put in the median yearly income for a full time worker in the U.S. and this was the calculation:

Capture

This, of course, doesn’t consider the cost of living differences, but it still offers an interesting perspective.

—————————

Lisa Wade is a professor of sociology at Occidental College. You can follow her on Twitter and Facebook.

Visual Economics posted a (mildly) interactive page comparing what percentage of their budget different nations spend on health, education, and their military. The three screenshots below are for health:

3

4

5

You can also look at the data via a list.  This data is the percentage of the budget spent on the military:

2

Via Look At This.

—————————

Lisa Wade is a professor of sociology at Occidental College. You can follow her on Twitter and Facebook.

Peter Hessler, at the New Yorker, discusses the practice of outsourcing art to China. According to Hessler, Chinese people, mostly from the countryside, are trained to paint copies of photographs or paintings en masse and those paintings are sold to tourists elsewhere in the world.

Painters pose in their workspace:

1

Paintings to be sold as souvenirs somewhere in the American West:

2

4

Venice?

3

5

See more at the slide show.

—————————

Lisa Wade is a professor of sociology at Occidental College. You can follow her on Twitter and Facebook.

Farrah F. sent us a link to an article on the website for Forward, a newspaper aimed at the American Jewish community. The article looks at the gender gap in pay at Jewish community organizations. According to the article,

…a Forward survey of 75 major American Jewish communal organizations found that fewer than one in six are run by women, and those women are paid 61 cents to every dollar earned by male leaders.

Incomes of leaders of the organizations they surveyed (data is from 2008 unless otherwise specified, and women are highlighted in blue):

1

2

3

The Forward’s survey was drawn from the most recent public records or, if that information wasn’t available, from the organization itself. The median salary for men was $287,702, while the median for women was $175,211, amounting to a ratio of 61 cents to one dollar.

More from the article:

Women comprise about 75% of those employed by federations, advocacy and social service organizations, and religious and educational institutions, but occupy only 14.3% of the top positions. Of the 11 female leaders identified in this survey, three are in interim roles.

gendergap-110409

In another article, Forward discusses family leave policies at Jewish organizations, finding that relatively few offer paid leave:

forwardchart-091009

chart2-091009

UPDATE: A few people have asked why I chose to post about these particular organizations. The short answer is: because that’s what I had. My interest here wasn’t in the religious aspect, but in the gender disparities in volunteer/community organizations; I suspect these same trends occur in a lot of similar organizations, not just Jewish ones. I wish I had info on a more general set, but I so far haven’t been able to find a study like this one, but for a wider array of organizations. If anyone knows of one, I’d love to post it.