demography

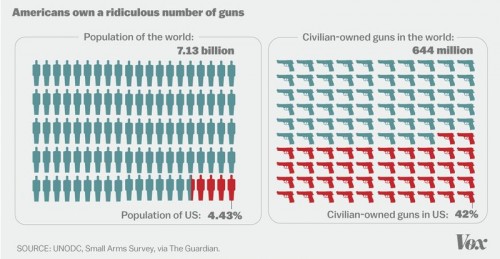
According to Vox, the U.S. has 4.43% of the world’s population and almost 42% of the world’s population of civilian-owned guns.

This is your image of the week:

2

It’s hard to say exactly, but there may be as many guns as there are people in the U.S., or even more guns than people. Since not everyone is a gun owner, that means that the typical gun owner owns more than one. In fact, they own, on average, 6.6 guns each. Two-thirds of the guns in the U.S. are in the hands of 20% of the population. Gun manufacturers know this and market accordingly.

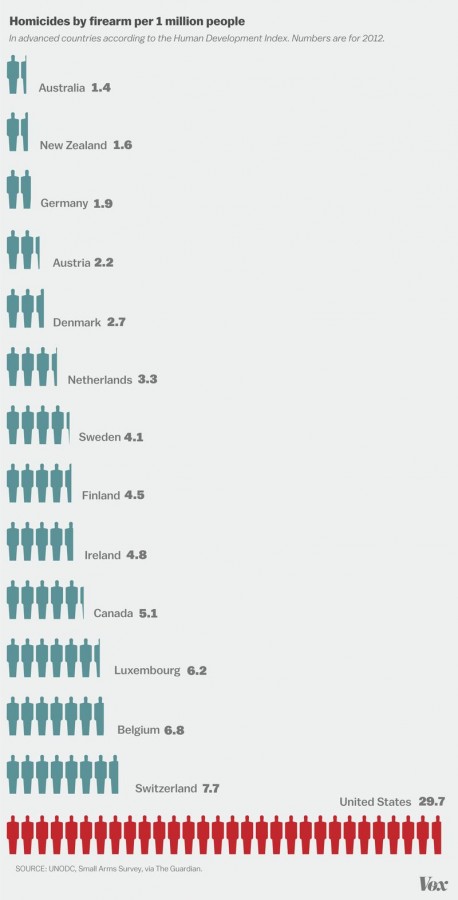
Gun ownership is correlated with both gun homicide and suicide. Accordingly, we also have the highest rate of gun violence of any developed country. In 2013, there were 21,175 gun suicides and 11,208 gun homicides.

4

This data was collected by the UNODC and compiled by the Guardian.

Lisa Wade, PhD is an Associate Professor at Tulane University. She is the author of American Hookup, a book about college sexual culture; a textbook about gender; and a forthcoming introductory text: Terrible Magnificent Sociology. You can follow her on Twitter and Instagram.

I wrote this for The Conversation. Read the original here.

Observers may be quick to declare social trends “good” or “bad” for families, but such conclusions are rarely justified. What’s good for one family – or group of families – may be bad for another. And within families, interests do not always align. Divorce is “bad” for a family in the sense of breaking it apart, but it may be beneficial, or even essential, for one or both partners or their children.

This kind of ambiguity makes it difficult to assess what kind of impact the recent recession and its aftermath had on families. But for researchers, at least, it offers a lot of job security – so many questions, so much going on. In any case, here’s where we stand so far.

The effect of the Great Recession on family trends in the United States has been dramatic with regard to birth rates and divorce, and has been strongly suggestive of family violence, but less clear for marriage and cohabitation.

Marriage rates declined, and cohabitation rates increased, but these trends were already underway, and the recession didn’t alter them much. When trends don’t change direction it’s difficult to identify an effect of a shock this broad. However, with both birth rates and divorce, clear patterns emerged.

Birth rates: a sharp drop

The most dramatic impact was on birth rates, which dropped precipitously, especially for young women, as a result of the economic crisis. How do we know? First, the timing of the fertility decline is very suggestive. After increasing steadily from the beginning of 2002 until late 2007, birth rates dropped sharply. (The decline has since slowed for some groups after 2010, but the U.S. still saw record-low birth rates for teenagers and women ages 20-24 as late as 2012.)

Second, the decline in fertility was steeper in states with greater increases in unemployment. Although we don’t have the data to determine which couple did or did not have a child in response to economic changes, this pattern supports the idea that financial concerns convinced some people to not have a child.

That interpretation is supported by the third trend: the fertility drop was more pronounced among younger women – and there was no drop at all among women over 40. That may mean the fertility decline represents births postponed by families that intend to have children later – an option older women may not have – which fits previous research on economic shocks.

It seems likely that people who are on the fence about having a baby can be swayed by perceived financial hardship or uncertainty. From research on 27 European countries, we know that people with troubled family financial situations are more likely to say they are unsure whether they will meet their stated childbearing goals – that is, economic uncertainty doesn’t change their familial aims but may increase uncertainty in whether they will be met.

However, some births delayed inevitably become births foregone. Based on the effect of unemployment on birth rates in earlier periods, it appears a substantial number of young women who postponed births will end up never having children. By one estimate, women who were in their early 20s during the Great Recession are projected to have some 400,000 fewer lifetime births and an additional 1.5% of them will never have a birth.

Divorce rates: a counter-intuitive reaction

In the case of divorce, the pattern is counter-intuitive. Although economic hardship and insecurity adds stress to relationships and increases the risk of divorce, the overall divorce rate usually drops when unemployment rates rise.

Researchers believe that, like births, people postpone divorces during economic crises because of the costs of divorcing – not just legal fees, but also housing transitions (which were especially difficult in the Great Recession) and employment disruptions.

My own research found that there was a sharp drop in the divorce rate in 2009 that can reasonably be attributed to the recession. But, as we suspect will be the case with births, there appears to have been a divorce-rate rebound in the years that followed.

Domestic violence: a spike along with joblessness

Family violence has become much less common since the 1990s. The reasons are not entirely clear, but they certainly include the overall drop in violent crime, improved response from social service and non-governmental organizations, and improvements in women’s relative economic status. However, when the recession hit there was a spike in intimate-partner violence, coinciding with the sharp rise in men’s unemployment rates (I show the trends here).

As with the other trends, it’s hard to make a case based on timing alone, but the evidence is fairly strong that the economic shock increased family stress and violence. For example, one study showed that mothers were more likely to report spanking their children in the months when consumer confidence fell. Another study found a jump in abusive head trauma cases during the recession in several regions. And there have been many anecdotal and journalist accounts of increases in family violence, emerging as early as 2009. Are these direct results of the economic stress or mere correlation? It’s hard to say for sure.

The ultimate impact of these trends on American families will likely take years to emerge. The recession may have affected the pattern of marriage in ways we don’t yet understand – how couples selected each other, who got married and who didn’t – and may create measurable group of marriages that are marked for future effects as yet unforeseen. Like the young adults who entered the labor market during the period of high unemployment and whose career trajectories will be forever altered unfavorably, how these families bear the scars cannot be predicted. Time will tell.

Philip N. Cohen is a professor of sociology at the University of Maryland, College Park. He writes the blog Family Inequality and is the author of The Family: Diversity, Inequality, and Social Change. You can follow him on Twitter or Facebook.

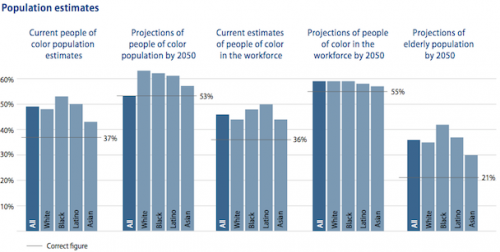
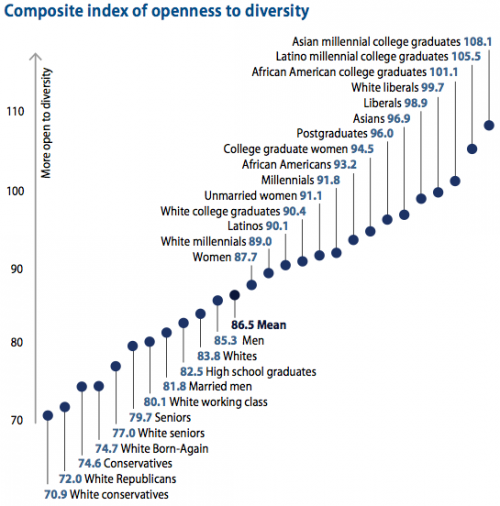
New survey data shows that the average person overestimates the diversity of the American population, both now and in the future.  Today, for example, racial minorities make up 37% of the population, but the average guess was 49%.

projections

Many Americans fear rising diversity.  Over half worry that more minorities means fewer jobs, nearly half think that it means more crime, and almost two-thirds think these groups strain social services.  If people think that minorities are bad for America and overestimate their prevalence, they may be more likely to support draconian and punishing policy designed to minimize their numbers or mitigate the consequences they are believed to bring.

Not all Americans, of course, fear diversity equally.  Below are the scores of various groups on an “openness to diversity” measure with a range of 0-160.

Screen Shot 2013-10-22 at 1.34.24 PM

For the future, Americans are still strongly divided as to what to do about diversity and the racialized inequality we currently see.

last chart

Via The Atlantic; thanks to @_ettey for the link.  Cross-posted at Pacific Standard.

Lisa Wade, PhD is an Associate Professor at Tulane University. She is the author of American Hookup, a book about college sexual culture; a textbook about gender; and a forthcoming introductory text: Terrible Magnificent Sociology. You can follow her on Twitter and Instagram.
New interest in the virgjinesha inspires us to re-post our coverage from 2012.

Rigid gender roles often inspire creative solutions.  Families in Afghanistan, for example, when they have all girls, often pick a daughter to pretend to be a boy until puberty.  The child can then run errands, get a job, and chaperone “his” sisters in public (all things girls aren’t allowed to do).  The transition is sudden and doesn’t involve relocation, so the entire community knows that the child is a girl.  They just pretend nothing at all strange is going on.  In fact, it’s not strange.  It happens quite routinely.

A similar phenomenon emerged in Albania in the 1400s.  Inter-group warfare had left a dearth of men in many communities.  Since rights and responsibilities were strongly sex-typed, some families needed a “man” to accomplish certain things like buy land and pass down wealth.

In response, some girls became “virgjinesha,” or sworn virgins. A sworn virgin was a socially-recognized man for the rest of “his” life (so long as the oath was kept).  Many girls would take the oath after their father died.

There are only about forty sworn virgins left; as women were granted more and more rights, fewer and fewer girls felt the need to adopt a male identity for themselves or their families.

Some of the remaining virgjinesha were featured in a New York Times slideshow.  Quotes from two individuals:

After becoming a man, Qamile Stema [below] said she could leave the house and chop wood with other men. She also carried a gun. At wedding parties, she sat with men. When she talked to women, she recalled, they recoiled in shyness.

Qamile Stema said she would die a virgin. Had she married, she joked, it would have been to a traditional Albanian woman. “I guess you could say I was partly a woman and partly a man, but of course I never did everything a man does,” she said. “I liked my life as a man. I have no regrets.”

Photographer Jill Peters has also captured images of sworn virgins.

Lisa Wade, PhD is an Associate Professor at Tulane University. She is the author of American Hookup, a book about college sexual culture; a textbook about gender; and a forthcoming introductory text: Terrible Magnificent Sociology. You can follow her on Twitter and Instagram.
Cross-posted at Family Inequality.

The other day I was surprised that a group of reporters failed to call out what seemed to be an obvious exaggeration by Republican Congresspeople in a press conference. Did the reporters not realize that a 25% unemployment rate among college graduates in 2013 is implausible, were they not paying attention, or do they just assume they’re being fed lies all the time so they don’t bother?

Last semester I launched an aggressive campaign to teach the undergraduate students in my class the size of the US population. If you don’t know that – and some large portion of them didn’t – how can you interpret statements such as, “On average, 24 people per minute are victims of rape, physical violence, or stalking by an intimate partner in the United States.” In this case the source followed up with, “Over the course of a year, that equals more than 12 million women and men.” But, is that a lot? It’s a lot more in the United States than it would be in China. (Unless you go with, “any rape is too many,” in which case why use a number at all?)

1

Anyway, just the US population isn’t enough. I decided to start a list of current demographic facts you need to know just to get through the day without being grossly misled or misinformed – or, in the case of journalists or teachers or social scientists, not to allow your audience to be grossly misled or misinformed. Not trivia that makes a point or statistics that are shocking, but the non-sensational information you need to know to make sense of those things when other people use them. And it’s really a ballpark requirement; when I tested the undergraduates, I gave them credit if they were within 20% of the US population – that’s anywhere between 250 million and 380 million!

I only got as far as 22 facts, but they should probably be somewhere in any top-100. And the silent reporters the other day made me realize I can’t let the perfect be the enemy of the good here. I’m open to suggestions for others (or other lists if they’re out there).

They refer to the US unless otherwise noted:

Description Number Source
World Population 7 billion 1
US Population 316 million 1
Children under 18 as share of pop. 24% 2
Adults 65+ as share of pop. 13% 2
Unemployment rate 7.6% 3
Unemployment rate range, 1970-2013 4% – 11% 4
Non-Hispanic Whites as share of pop. 63% 2
Blacks as share of pop. 13% 2
Hispanics as share of pop. 17% 2
Asians as share of pop. 5% 2
American Indians as share of pop. 1% 2
Immigrants as share of pop 13% 2
Adults with BA or higher 28% 2
Median household income $53,000 2
Most populous country, China 1.3 billion 5
2nd most populous country, India 1.2 billion 5
3rd most populous country, USA 315 million 5
4th most populous country, Indonesia 250 million 5
5th most populous country, Brazil 200 million 5
Male life expectancy at birth 76 6
Female life expectancy at birth 81 6
National life expectancy range 49 – 84 7

Sources:
1. http://www.census.gov/main/www/popclock.html
2. http://quickfacts.census.gov/qfd/states/00000.html
3. http://www.bls.gov/
4. Google public data: http://bit.ly/UVmeS3
5. https://www.cia.gov/library/publications/the-world-factbook/rankorder/2119rank.html
6. http://www.cdc.gov/nchs/hus/contents2011.htm#021
7. https://www.cia.gov/library/publications/the-world-factbook/rankorder/2102rank.html

Philip N. Cohen is a professor of sociology at the University of Maryland, College Park, and writes the blog Family Inequality. You can follow him on Twitter or Facebook.

The ’60s is often held up as a time of dramatic upheaval in American life.  It brought us civil rights victories, the sexual revolution, the women’s movement, the gay liberation movement, and anti-war activism.  It was, in short, antiestablishmentarian.

What were the concrete impacts of these changes?  One is the birth rate, as illustrated in a post by Made in America‘s Claude S. Fischer. Far from introducing a new normal, the ’60s reversed what was a relatively recent a rise in the ideal number of children and actual fertility rate.

While data not shown suggest that the ideal number of children in the ’30s was under three, the ideal had risen to 3.6 by 1962.  This dropped quickly across the rest of the decade.

2

Likewise, the actual number of children born to the average woman in the 1930s was about two, but this started shooting up in the late ’30s and ’40s.  Then, just as quickly as it had risen, it plummeted again:

1

This data reminds us of how unusual the ’50s really was.  It was an especially pro-natal family-centered time.  As historian Stephanie Coontz puts it:

At the end of the 1940s, all the trends characterizing the rest of the twentieth century suddenly reversed themselves. For the first time in more than one hundred years, the age for marriage and motherhood fell, fertility increased, divorce rates declined, and women’s degree of educational parity with men dropped sharply.  In a period of less than ten years, the proportion of never-married persons declined by as much as it had during the entire previous half century.

So, while in some ways the 1960s dramatically changed American culture, in other ways it simply put us back on track.

Lisa Wade, PhD is an Associate Professor at Tulane University. She is the author of American Hookup, a book about college sexual culture; a textbook about gender; and a forthcoming introductory text: Terrible Magnificent Sociology. You can follow her on Twitter and Instagram.
CollegeHumor posted a set of fake Puritan-themed Valentine’s Day cards.  They’re a humorous way of reminding us that our intensive focus on romantic love as a driving force for sex and marriage is, in fact, quite new.

1

When the Puritans landed on the rocky east coast of America in the 1600s, they brought with them the belief that sex should be restricted to intercourse in marriage, hence the sentiment on the left. All non-marital and non-reproductive sexual activities were forbidden, including pre- and extra-marital sex, homosexual sex, masturbation, and oral or anal sex (even if married).   Violations of the rules were punished by fines, whipping, public shaming (yes, with “scarlet letters”), ostracism, or even death.

Alongside religion, there were practical reasons why the Puritans were so darn puritanical.  Colonizing the U.S. was a dangerous job; lots of people were dying from exposure, starvation, illness, and war.  Babies replenished the labor supply, motivating the Puritans to channel the sex drive towards the one sexual activity that made babies: intercourse. Accordingly, having intercourse with your spouse wasn’t only allowed, it was essential; women could divorce men who had proven impotent.  

The Puritans also married primarily to form practical partnerships for bearing children and mutual survival, hence the sentiment in the card on the right.

The idea that love should be the basis for marriage didn’t take hold until the Victorian era, when industrialization was changing the value of children.  Useful on the farm, children were suddenly became a burden in expensive and overcrowded lodgings.  This gave couples a new reason to limit the number of children they had and, because industrial production had made condoms increasingly cheap and effective, they could.  Marital fertility rates dropped precipitously between 1800 and 1900: from 6+ children/woman to 3 1/2 in the U.S., England, and Wales.

In this context, a Puritan sexual ethic that restricted sex to efforts to make babies just didn’t make sense. People needed a new logic to guide sexual activity: the answer was love. Over the course of the 1800s, Victorians slowly abandoned the Puritan idea that sex was only for reproduction, embracing instead the now familiar idea that sex could be an expression of love and a source of pleasure, an idea that still resonates strongly today.

That’s at least part of the story anyway.

Sources:

Bremer, Francis J., and Tom Webster.  2006. Puritans and Puritanism in Europe and America: A Comprehensive Encyclopedia. SantaBarbara: ABC-CLIO, Inc.

D’Emilio, John & Estelle Freedman. 1997. Intimate Matters: A History of Sexuality in America. Chicago: University of Chicago Press.

Freedman, Estelle. 1982. Sexuality in Nineteenth Century America: Behavior, Ideology, and Politics. Reviews in American History 10, 4: 196-215.

Lisa Wade, PhD is an Associate Professor at Tulane University. She is the author of American Hookup, a book about college sexual culture; a textbook about gender; and a forthcoming introductory text: Terrible Magnificent Sociology. You can follow her on Twitter and Instagram.
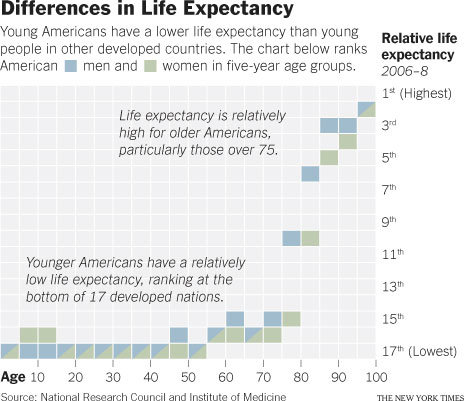
The Institute of Medicine and the National Research Council released some damaging numbers this month: Americans ranks startlingly low in life expectancy, compared to 16 other similarly developed countries.  This is especially true for younger Americans. Indeed, among people 55 and under, we rank dead last.  Among those 50-80 years old, our life expectancy is 3rd or 2nd to last.

Sabrina Tavernise at the New York Times reports that the “major contributors” to low life expectancy among younger Americans are high rates of death from guns, car accidents, and drug overdoses.  We also have the highest rate of diabetes and the second-highest death rate from lung and heart disease.

Americans had “the lowest probability over all of surviving to the age of 50.”  The numbers for American men were slightly worse than those for women. Overall, life expectancy for men was 17 out of 17; women came in 16th.  Education and poverty made a difference too, as did the more generous social services provided by the other countries in the study.

What isn’t making a difference?  Apparently our incredible rate of health care spending.

Via Citings and Sightings.

Lisa Wade, PhD is an Associate Professor at Tulane University. She is the author of American Hookup, a book about college sexual culture; a textbook about gender; and a forthcoming introductory text: Terrible Magnificent Sociology. You can follow her on Twitter and Instagram.