
Cross-posted at Family Inequality.
The other day I was surprised that a group of reporters failed to call out what seemed to be an obvious exaggeration by Republican Congresspeople in a press conference. Did the reporters not realize that a 25% unemployment rate among college graduates in 2013 is implausible, were they not paying attention, or do they just assume they’re being fed lies all the time so they don’t bother?
Last semester I launched an aggressive campaign to teach the undergraduate students in my class the size of the US population. If you don’t know that – and some large portion of them didn’t – how can you interpret statements such as, “On average, 24 people per minute are victims of rape, physical violence, or stalking by an intimate partner in the United States.” In this case the source followed up with, “Over the course of a year, that equals more than 12 million women and men.” But, is that a lot? It’s a lot more in the United States than it would be in China. (Unless you go with, “any rape is too many,” in which case why use a number at all?)
Anyway, just the US population isn’t enough. I decided to start a list of current demographic facts you need to know just to get through the day without being grossly misled or misinformed – or, in the case of journalists or teachers or social scientists, not to allow your audience to be grossly misled or misinformed. Not trivia that makes a point or statistics that are shocking, but the non-sensational information you need to know to make sense of those things when other people use them. And it’s really a ballpark requirement; when I tested the undergraduates, I gave them credit if they were within 20% of the US population – that’s anywhere between 250 million and 380 million!
I only got as far as 22 facts, but they should probably be somewhere in any top-100. And the silent reporters the other day made me realize I can’t let the perfect be the enemy of the good here. I’m open to suggestions for others (or other lists if they’re out there).
They refer to the US unless otherwise noted:
| Description | Number | Source |
| World Population | 7 billion | 1 |
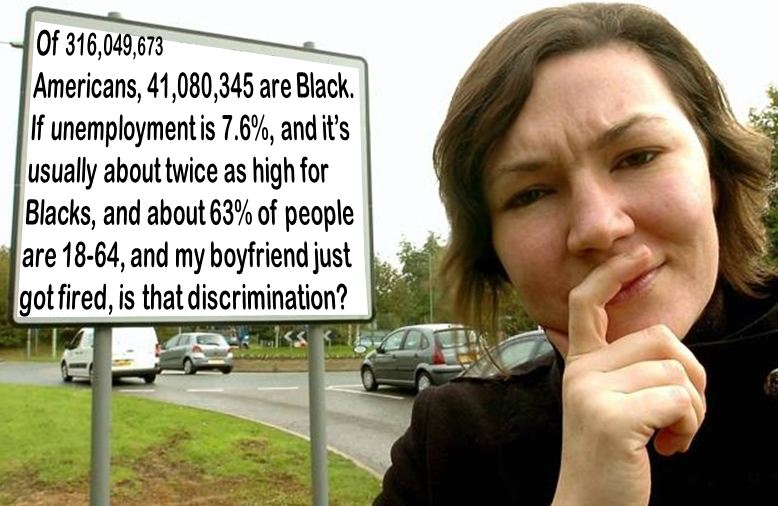
| US Population | 316 million | 1 |
| Children under 18 as share of pop. | 24% | 2 |
| Adults 65+ as share of pop. | 13% | 2 |
| Unemployment rate | 7.6% | 3 |
| Unemployment rate range, 1970-2013 | 4% – 11% | 4 |
| Non-Hispanic Whites as share of pop. | 63% | 2 |
| Blacks as share of pop. | 13% | 2 |
| Hispanics as share of pop. | 17% | 2 |
| Asians as share of pop. | 5% | 2 |
| American Indians as share of pop. | 1% | 2 |
| Immigrants as share of pop | 13% | 2 |
| Adults with BA or higher | 28% | 2 |
| Median household income | $53,000 | 2 |
| Most populous country, China | 1.3 billion | 5 |
| 2nd most populous country, India | 1.2 billion | 5 |
| 3rd most populous country, USA | 315 million | 5 |
| 4th most populous country, Indonesia | 250 million | 5 |
| 5th most populous country, Brazil | 200 million | 5 |
| Male life expectancy at birth | 76 | 6 |
| Female life expectancy at birth | 81 | 6 |
| National life expectancy range | 49 – 84 | 7 |
Sources:
1. http://www.census.gov/main/www/popclock.html
2. http://quickfacts.census.gov/qfd/states/00000.html
3. http://www.bls.gov/
4. Google public data: http://bit.ly/UVmeS3
5. https://www.cia.gov/library/publications/the-world-factbook/rankorder/2119rank.html
6. http://www.cdc.gov/nchs/hus/contents2011.htm#021
7. https://www.cia.gov/library/publications/the-world-factbook/rankorder/2102rank.html
Comments 36
Quijotesca — July 4, 2013
What about disabled people?
Umlud — July 4, 2013
This is a great topic. A lot of people seem to get through undergraduate without an understanding of how to think about numbers as they apply to the world in which we all live. I read a really useful book called Innumeracy that really did a good job (in my opinion) of laying out how to think critically about numbers that govern our everyday lives.
For my own field, I also got the book Ecological Numeracy, which ran through many of the same lessons and underlying logic - but from a complementary viewpoint.
I personally think that - just like learning the Classics (or at least just taking classes in the Classics) is presently a required part of a Liberal Arts education - courses on applied numeracy ought to be included, too. Yes, I know that the physical sciences, engineering, economics, and many other disciplines utilize objective metrics to conduct their work, but many of the courses that teach these metrics (at least the ones that I took) fail to show how to apply those metrics (and the principles underlying them) to problems that extend beyond the practice sets and exams.
rayuela — July 4, 2013
American Indians? Really now?
mspaeth — July 4, 2013
Lies, damn lies, and "statistics".
The only way to get from 24 per minute to 12M per year is to pretend that each person is only "victimized" for one minute one time during the year, otherwise your simple multiplcation of 24 victims/minute * 60 minutes/hour * 24 hours/day * 365.25 days / year = 12.6M victims / year is a complete load of bull.
Perhaps you should be "teaching" your students something you actually understand yourself instead of making up numbers.
Witt — July 4, 2013
I like the idea of giving people tools to think critically about the information they're presented with. I try to help my interns use common-sense double-checking -- e.g., if they know that our city has 3 million residents, and they know that educational-level data is only collected for people 25 and over, then it should be a giant red flag if population total in the "education level" chart is 2.9 million.
Brutus — July 4, 2013
Within 20% is pretty damn precise. The Fermi method of estimating unknown quantities considers itself accurate if it gets within an order of magnitude of the actual value; for US population, that would mean anywhere between 30M and 3B would be good estimates.
ETA: Fermi Estimates
Joseph M — July 5, 2013
Best book/site for getting your head around statistics - The Flaw of Averages
http://www.flawofaverages.com/
Anna — July 5, 2013
Something to be cautious of: Demographics can be highly unreliable in many parts of the world. An example I am familiar with because I had to work with it is South Africa. Firstly, not every country has a reliable system for collecting demographics, and governments also frequently limit how much foreign agencies can intervene. Secondly, depending on the level of transparency in the country, demographics may be highly tinkered with. Finally, there can also be significant regional differences in collecting/reporting demographics within countries.
I think emphasizing awareness demographic facts is important, but only in optimal conditions. I assume you are suggesting that they are reliable when referring to the USA. But it is equally important to teach students to be skeptical with demographics throughout many parts of the world, to treat them as rough estimates at best, that is, if you can take them seriously at all. I am aware this sounds conspiracy theorish, but it's not. It is, in its own sad way, a fact.
fact-checker — July 5, 2013
You didn't listen to the press conference very carefully. A House Republican was referring to RECENT COLLEGE GRADUATES, which is more plausible. The unemployment rate in May for all teenagers 24.5%, according to the BLS. And according to a fecent BLS study, more than 25 percent of recent graduates were not employed (though, to be accurate, not all of them were seeking jobs and in the workforce). http://bls.gov/opub/mlr/2013/02/art1full.pdf
Michael Bedard — July 5, 2013
Love this topic... you might find the "Dictionary of Numbers" interesting, since it's somewhat related. http://blog.xkcd.com/2013/05/15/dictionary-of-numbers/
Oftentimes, people have no idea what huge numbers mean... perhaps we need a "dictionary of populations?"
another will — July 7, 2013
You touched on this in your article, but perhaps in addition to population counts and percentages, some time-based math.... When this "happens every 20 seconds" or that "affects dozens of people every day", what do those numbers really mean in meaningful contexts?
Brandon — July 8, 2013
I'd add the US government's annual budget.
Christie — July 8, 2013
I'd like to see an inclusion of the LGBT community here, especially with the recent SCOTUS decision. Also, I second the suggestion of including people with disabilities.
Old Russia – three questions | eurasianstudies — July 9, 2013
[...] and Social Affairs that Russia’s population is “old.” As Sociological Images reminds us, there are a lot of numbers we should know, or at least know to ask about, when we’re [...]
Collection Day | Foreign Holidays — July 12, 2013
[...] small collection of real demographics of the [...]
22 Current Demographic Facts That Everyone Should Know - — July 25, 2013
[...] post originally appeared on Sociological Images, a Pacific Standard partner [...]