demography

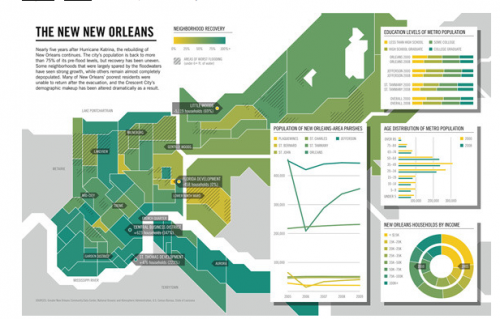
Allie B. sent us a link to an image at GOOD that presents some pre- and post-Katrina information about New Orleans. The map indicates levels of population recovery; the darker the shade of green, the more the population has rebounded:

A close-up of one section (areas with black shading had over 6 feet of floodwater):

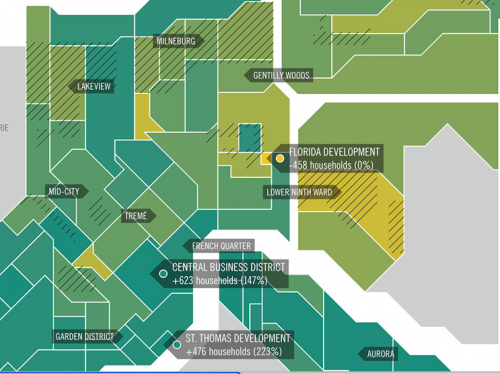
Notice that the Lower Ninth Ward, one of the hardest-hit areas, has among the lowest level of redevelopment.

There’s a much larger version of the map (with a not-too-specific list of sources) here.

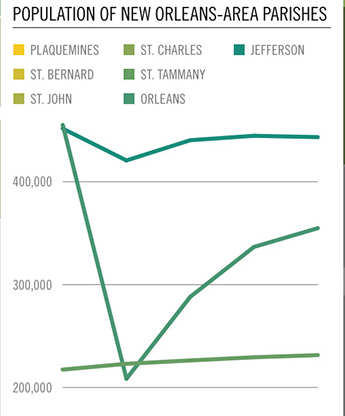
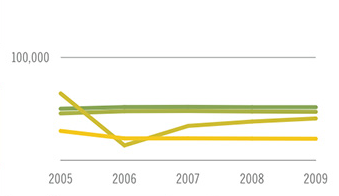
Changes in the populations of different parishes:

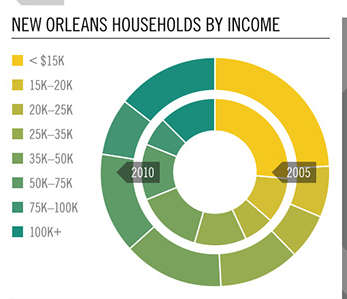
The income distribution has changed somewhat as well, with a smaller proportion in the lowest income categories (though notice that the dollar range included in each color isn’t consistent as you get into the higher incomes):

Martin W. found two neat graphs over at The Horizon that show the 2000 world population’s distribution by latitude and longitude.

It’s not that they’re shocking, in the sense that of course we’d expect more people to be living in temperate/tropical latitudes than in the Arctic, given availability of resources to support human settlements (at least until the development of modern conveniences like heat, canned food, and quick transportation to get them to people far from their sources). And the huge spikes where China and India are make sense too. But I still think it’s visually striking to see, for instance, how little of the world’s population is located in the Americas. And the patterns we see here certainly have important implications for global economic development and the likely highly uneven distribution of negative impacts of environmental/climate change, among other issues.

But then, I’m also just a geek about maps and like looking at them in general.

Nationalist white supremacy organizations, and their gentler counterparts in the U.S., sometimes argue that non-white women are having more children than white women.  The result is a shift in the national demographic (that they don’t like).

This month the Pew Research Center released a report on the changing demographics of American motherhood (discovered thanks to a tip by Michael Kimmel).  Under “Mother’s Race,” we see that there has been a 12 percentage point decrease in the share of births to white women between 1990 and 2008.  In contrast, births to Asian and, especially, Hispanic women have increased (a combined 13 percentage points):

The share of births to native versus foreign born women has also shifted, with a quarter of births now to women who have immigrated to the U.S.:

They summarize:

White women made up 53% of mothers of newborns in 2008, down from 65% in 1990. The share of births to Hispanic women has grown dramatically, to one-in-four.

So, whether you agree with the national white supremacists’ evaluation of the data or not (I assume you do not), they’re right about the data.

UPDATE: Sabrina, in the comments, rightly points out that my comments assume that the father’s race matches the mother’s.

Lisa Wade, PhD is an Associate Professor at Tulane University. She is the author of American Hookup, a book about college sexual culture; a textbook about gender; and a forthcoming introductory text: Terrible Magnificent Sociology. You can follow her on Twitter and Instagram.

Our online host, Contexts magazine, is offering some free content, a selection of essays on aging, now through March 15th.  I borrowed the material below from the essay, “Facts and Fictions About an Aging America.”

The average American is aging… and fast.  Advances in public health — especially related to childbirth, infant mortality, and infectious disease — have led to longer lives.   “The result is that death has been permanently shifted from a phenomenon among the young to one of the old.”  This means that the age distribution in the U.S. has shifted from one shaped like a neat pyramid (in 1900), to one shaped kind of like a house (in 2000), to whatever shape that is they’re predicting in 2050:

The great news is that “active life span is increasing faster than total life span.”  That is, even though we live longer, we spend fewer of our years sick or disabled than ever before.  This is called (so you can impress your friends) the “compression of morbidity.”

Lisa Wade, PhD is an Associate Professor at Tulane University. She is the author of American Hookup, a book about college sexual culture; a textbook about gender; and a forthcoming introductory text: Terrible Magnificent Sociology. You can follow her on Twitter and Instagram.

p.j. sent in a link to the trailer for the movie “Demographic Winter,” which apparently educates us about the coming downfall of humanity, or at least humanity in developed nations:

Thus, gay rights, women’s rights, and non-marital sexuality are not just immoral, they’re literally threatening the very survival of the human species.

Well, maybe not the human species. Certain members of the human species, those that live mainly in Europe and the U.S. Of course, what we’re really getting at here, ultimately, is the fear that Whites in developed nations are not reproducing sufficiently. For another example of this, see our post on the Louisiana Senator who proposed paying “these people” and “illegal aliens” $1,000 to be sterilized.

In both cases, women’s reproductive capacity would ultimately be targeted as a means to a social goal–one group of women will need to give up their silly concerns about women’s equality and start having more babies (and gay men gotta start impregnating women!), while other women must be discouraged from having them. It’s a story we’ve heard many, many times before.

Gwen Sharp is an associate professor of sociology at Nevada State College. You can follow her on Twitter at @gwensharpnv.

From statehealthfacts.org using data from 2006:

Picture 1

At the website you can scroll over each state to see the exact number. The overall rate for the U.S. is 10.2 per 100,000. The high is in the District of Columbia, at 20.6; the high among states was 19.3 in Louisiana. The lowest rate is in Hawaii–2.5 per 100,000.

I don’t know what’s going on in the U.S. Virgin Islands–the table has a rate of 43.2 per 100,000. Perhaps that’s statistical noise in the estimate due to the fact that the territory has a total population of only about 110,000, which might distort rates given per 100,000 population.

I am also embarrassed to admit that until this very moment I thought the Virgin Islands were somewhere in the Pacific, probably near Tahiti. Turns out it’s in the Caribbean. Huh.

The Pew Forum on Religion & Public Life just released the results of a global study of Muslims. The interactive map lets you hover over a country and see what percent of its population is Muslim, and what percent of all Muslims reside there. It will be a surprise to many people to see what a small proportion of Muslims live in Arab countries.

Muslims

This map weights each country by population size (larger version here):

world-distribution-weighted

By region:

Pie-chart

Full report here.

Using maternal mortality, Hans Rosling illustrates the uncertainty in different ways of measuring variables:

Found at GapMinder.

—————————

Lisa Wade is a professor of sociology at Occidental College. You can follow her on Twitter and Facebook.