class

Brandon H. let me know about two viral Smirnoff videos that humorously illustrate some of the differences (perceived and real) between “old money” families and the newly rich.

The old money/East Coast version:

Argyle sweaters! White pants! Pearls!

The nouveau riche West Coast version:

Massages! Spray tans! Collagen implants!

Of course, there’s other interesting stuff going on here, too–the typical “women as background dancers/accessories” theme, the lack of non-White people, the way that moisturizer and lip balm is associated with a laughable masculinity. Of course, by current popular ideals of masculinity, both of these groups of men come up lacking, and in fact, rich men are often both idolized and portrayed as intellectual but not really “manly” (which is reserved for hard-workin’ midwestern types).

Also: Joe’s Crab Shack, what does rich look like?, masculinize your sissy upper-class dogs with Alpo, women as prizes for rich men, representing the working class at Honfest, evoking class with literary references, upper-class luxury in ads, communicating class in Cadillac ads, “class is forever“, and old money is old-fashioned.

Nikki L. sent us a link to this fascinating Tickle Me Elmo commercial.  In introduces a new Tickle Me Elmo product, “Tickle Hands.”

The ad takes place on what appears to be an urban street (reminiscent of Sesame Street).  Two of the kids appear white, while the other two look (probably deliberately vaguely) “racial,” maybe Asian and Latino (perhaps biracial).  At the very end of the commercial the kids pose in front of a brick wall with a picture of Elmo graffiti-style.  Two of them look like they’re flashing gang signs and Elmo, no joke, says “Yeahhhhhh Booooy.”  Here’s a screen shot of the moment:

Capture

So let’s trace the evolution of the gangster meme.

1.  Government policy strips urban centers of resources, jobs leave (along with useful things like grocery stores), housing prices fall and the poor become concentrated, and those with means move to the suburbs.  With few “above ground” economic options, people turn to “underground” economies.  With only the “underclass” left, politicians (who tend to listen more to those with economic power and cultural clout) continue policies that disinvest in urban communities of color.  Say “goodbye” to things like nice parks and excellent fire protection.

2.  In a world where obeying the rules gets you nowhere fast, violence flourishes.

3.  The suffering and resourcefulness of young black, Latino, and Asian men in these communities appeals to a (mostly) white “mainstream” America for whom depictions of men of color doing violence confirms their beliefs about white superiority and advanced “civilization.”  Hip hop and rap music becomes a huge money maker for music studios and producers (and a handful of men of color).

4.  As hip hop and rap become commodified, they are depoliticized.  The “oppositional consciousness” that once characterized these art forms becomes largely lost.  For the most part, any artist that wants to “make it” has to be and say what producers think that mainstream Americans want them to do and say.

5.  Now depoliticized, being “hard” and “urban” becomes synonymous with being “cool.”  Everyone wants to be cool.

6.  Being “gangster” is appropriated by white suburban youth.

7.  Stripped of any meaning, it filters down to younger and younger kids.

Enter: Tickle Me Elmo “tickle hand” gang signs.

For more examples of this phenomenon, see these advertising images at a shoe store, Beyonce’s House of Dereon clothing line for girls, the marketing for the Alvin and the Chipmunks remake, and these candy “grills.”

—————————

Lisa Wade is a professor of sociology at Occidental College. You can follow her on Twitter and Facebook.

Lisa Wade, PhD is an Associate Professor at Tulane University. She is the author of American Hookup, a book about college sexual culture; a textbook about gender; and a forthcoming introductory text: Terrible Magnificent Sociology. You can follow her on Twitter and Instagram.

tumblr_kpgy8xxhuW1qz7ng1o1_500-1

In the Bible (book of Genesis), God sends two angels to the cities of Sodom and Gomorrah. These angels were charged with the task of evaluating the rate of sin within the walls. If the people were completely overridden by sin, God would destroy them.

What if those angels were statisticians, with access to GIS and geomapping software? How would the story have been different?

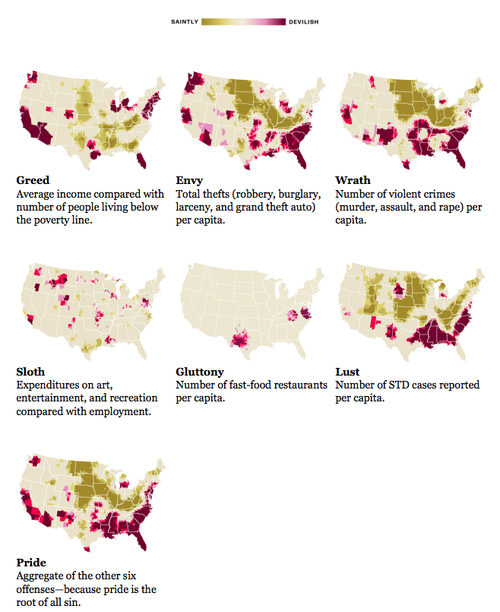
Some geographers at Kansas State University recently did an analysis of the spacial distribution of EVIL in the United States. Which part of the country is most afflicted by sloth? Lust? Greed? Envy? Wrath? Gluttony? Pride?

That’s right, folks – these geographers have operationalized sin, quantified it, then measured and mapped it. Pride is the aggregate distribution of all other sins, since it is supposedly the root of all evil (though one could also make a good case for apathy). Here’s how the sins are measured (and here’s a good view of the maps):

  • Greed: Average incomes versus total inhabitants below the poverty line
  • Envy: Total number of thefts (robbery, burglary, larceny, and stolen cars)
  • Wrath: Total number of violent crimes (murder, assault and rape) per capita
  • Lust: Sexually transmitted diseases per capita
  • Gluttony: Number of fast-foot restaurants per capita
  • Sloth: Expenditures on arts, entertainment and recreation versus rate of employment
  • Pride: An aggregate of the six other sins

By looking at sin at the aggregate level, what they’re doing here is examining sin as a social fact, as opposed to an individual trait. This would be a good extension of a lesson on Durkheim and suicide as a social fact. This study really shows why we really can’t truly measure concepts such as this across space and time, since the meaning of these individual acts will vary. Are the same acts categorized and labeled as rape in Montana as they are in New York? How violent does a person need to be before they are arrested for assault, and does that differ by region? Are we really measuring rates of STDs, or rates at which people get treatment for them? If my measure of gluttony is different than yours, can I apply my measure to your actions and call you gluttonous? Or should I be using your measures to evaluate your actions? Is this aggregate data showing different rates of sin, or is it just an effect of different meanings attached to the concepts?

This would also be useful in showing how we can’t extrapolate individual characteristics from aggregate data. For example, I live in Indiana (but teach in Kentucky). This region is low in envy, lust, wrath, and pride; average in gluttony, sloth, and greed; and not particularly high in any of the sins. Apparently I live in one of the more virtuous parts of the country.

I guess I can cancel that fire and brimstone insurance.

But does this aggregate data also indicate that I, Anomie, have greater odds of being virtuous? NO. The fact that I am virtuous in every way is merely a coincidence. You see, their data is not measuring individual sinful behavior. Rather, it’s measuring social facts, and structural conditions, that they hypothesize to be correlated with individual sinful behavior (but I take issue with some of the measures). For example:

  • I don’t have any STDS. CLEARLY I am not lustful. CLEARLY.
  • If you have more fast food restaurants within a five mile radius of your house than I do, are you more gluttonous than me? No. But at the aggregate level, this may be a good quick and dirty device. At least they didn’t use obesity rates as their measure.
  • And if I make $100k (one can dream) in Indiana, then move elsewhere to a job with the same salary, does that mean my greediness has changed along with my place of residence?

Now, excuse me while I get back to my slothful appreciation of art.

——————————

Angie Andriot, also known as Wicked Anomie, maintains the (mostly) sociology blog Wicked Anomie: Sociology Run Amok. On occasion, she likes to toss off her cape, hop offline, and play the role of Angie Andriot: Grad Student Extraordinaire – deftly juggling the writing of her dazzling dissertation at Purdue University with the imparting of wisdom to her lovely students at University of Louisville. She is particularly fond of symbolic interactionism. And cheese.

If you would like to write a post for Sociological Images, please see our Guidelines for Guest Bloggers.

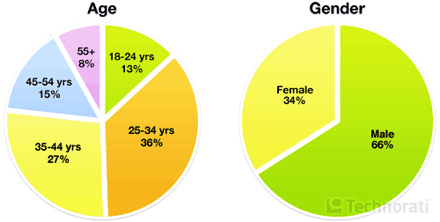
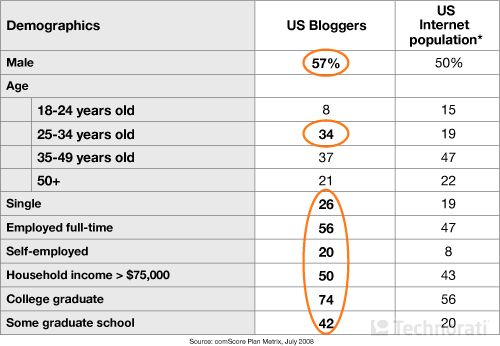
The answer to that question matters because, even if bloggers don’t have the ability to control what we think, they do, to a certain extent, shape what we think about.  And bloggers can sometimes make enough noise to be heard.

Kay Steiger drew my attention to the findings of a study of the blogosphere by Technorati.  Below are a selection of their findings, click over for more on who blogs and answers to other interesting questions:

3905002482_b7ef56e56f

chart-p1-location-2

chart-p1-salary

table-p1-usbloggers

—————————

Lisa Wade is a professor of sociology at Occidental College. You can follow her on Twitter and Facebook.

At one time in history (vague, I know), elite sons would make their mark on the world, first, in battle.  Increasingly, however, in the U.S., elites use their privilege to avoid military service.  The most recent wars have been fought, disproportionately, by men and women from the working class.

The military knows this, as illustrated by this Army National Guard recruitment pamphlet sent in by Leafan R., who found it on the Rutgers University campus:

0829091115

—————————

Lisa Wade is a professor of sociology at Occidental College. You can follow her on Twitter and Facebook.

Jerry F. sent us a link to a neat interactive website where you can look at global GDP per capita by country, region, predominance of Buddhism/Islam/Christianity, language spoken, and so on. The data come from the 2008 CIA World Factbook.

The country with the highest GDP per capita? That would be itsy-bitsy Liechtenstein:

Picture 1

Much of Liechtenstein’s economy is linked to its popularity as a place to register holding companies because of low business taxes, so the exceedingly high GDP is probably a result of that. With a GDP of $103,500, Qatar is the second wealthiest nation.

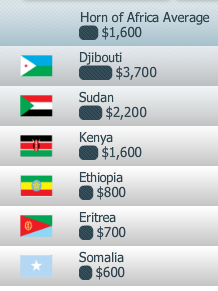
Compare that snapshot of part of the Europe graph to this one for countries in the Horn of Africa:

Picture 2

From what I could tell, the lowest per capita GDP is in Zimbabwe: $200. Only one country on the entire African continent (Equatorial Guinea) breaks $20,000. The shockingly low GDPs in Africa, which indicate a continued lack of industrial (or any other) development, is the most striking pattern. Poor countries in Asia and South America seem downright wealthy by comparison.

As with any international database, I’m sure there are weaknesses with the Factbook–if nothing else, the difficulty of collecting meaningful, comparable data for all countries. I’d pay attention to the overall pattern rather than the specific dollar amount for any one country. If any of you have specific knowledge of the strengths and weaknesses of the CIA Factbook, let us know in the comments.

And also, of course, these numbers tell us nothing about how national wealth is distributed within each country. The average standard of living might be better in a country with a lower GDP where wealth is more evenly distributed across the population than in a “richer” country where a small group controls a highly disproportionate amount of wealth.

Related posts: military spending as a % of GDP, map of global use of electric lights after dark, carbon dioxide emissions per country, questioning the developed/undeveloped binary, international disproportions, and inequality in affluent nations.

Reading Resist Racism, I found a link to an article in this Sunday’s Washington Post by a journalist by the name of Amit Paley who chronicled her exploration of “tribes” in Thailand.  The article is a study in class privilege, with a global twist.  It begins with the sentence: “You can see almost anything in the world if you pay enough.”

She wanted to see women of the Padaung (or Kayan), who are from Burma but now live in Thailand as refugees.  The Kayan women are famous for wearing brass rings around their necks, leading to the illusion of an elongated neck created by the depression of their collarbone. Paley writes:

Ever since I glimpsed the Padaung as a child in my grandfather’s National Geographics, I had wanted to see these curious women, who suffer painful disfigurement to emerge as graceful beauties.

Her description of human beings, indirectly, as curiosities, combined with the comment that you can see “anything… if you pay enough” (my emphasis) is an excellent example of the objectification of ethnic others.

Paley’s desire to see these women is almost thwarted by the majority of tourist companies in Thailand who describe her effort as exploitative and immoral.  They even suggest that the women are “prisoners held captive in the villages by businessmen” making money off of tourism.  This is confirmed by Wikipedia, for what it’s worth.

This doesn’t stop Paley, who keeps asking until she finds a company that will take her to one of the remote villages in which Kayan women live.

The women she meets confirm that they wear traditional garb, continue traditional practices (such as the brass rings), and are even forced to remain in the villages, in order to attract tourists.  Men, largely, appear to be exempted from earning their keep in this way.

Paley says that one powerful male village member said that the women “must wear the dress because of tradition” and “spoke excitedly about its appeal to tourists and noted that half of the village’s income of $30,000 a year comes from tourism.”

A woman in brass rings told her “We do it to put on a show for the foreigners and tourists!”

Paley finishes with this lackluster reflection:

So is it unethical to visit the long-necked women? It is clearly true that money spent to visit them supports an artificial village from which they essentially cannot leave. On the other hand, many of them appeared to prefer living in virtual confinement as long as they are paid and safe. According to what they told me, their situation beats the alternative of living in a repressive country plagued by abject poverty and hunger.

I don’t feel guilty about visiting the Padaung, but my feelings might be different if I had traveled solely as a tourist rather than as a journalist. And I certainly don’t like their lot in life:  Shouldn’t everyone have the freedom to live and travel wherever they want?

Well, Paley has shown that she certainly does have that freedom.  And she is apparently willing to use her “journalist” identity to justify just about any advantage that her privilege affords her.


Lisa Wade, PhD is an Associate Professor at Tulane University. She is the author of American Hookup, a book about college sexual culture; a textbook about gender; and a forthcoming introductory text: Terrible Magnificent Sociology. You can follow her on Twitter and Instagram.

The income gap between the rich and the poor is larger in the U.S. than in most other industrialized countries.  Last year we posted data about the percent of total U.S. income that went to the top 1% of earners (23% as of 2006).

The graph below, recently updated to 2007, shows the percent of total U.S. income that went to the top 0.01%, that is 1/100th of one percent, of earners:

Picture1

As you can see, in 2007,  the top 1/100th of 1% of earners in the U.S. brings home 6% of the total income earned in the U.S.  This represents the largest proportion of total income since at least 1913, and is the endpoint in a trajectory of rising inequality that began in the early 1980s.

Also see our posts breaking down CEO compensation, on the disproportionate tax burden by social class, and on class inequality across U.S. states.

Data borrowed from economist Emmanuel Saez, via Matthew Yglesias.

—————————

Lisa Wade is a professor of sociology at Occidental College. You can follow her on Twitter and Facebook.