class

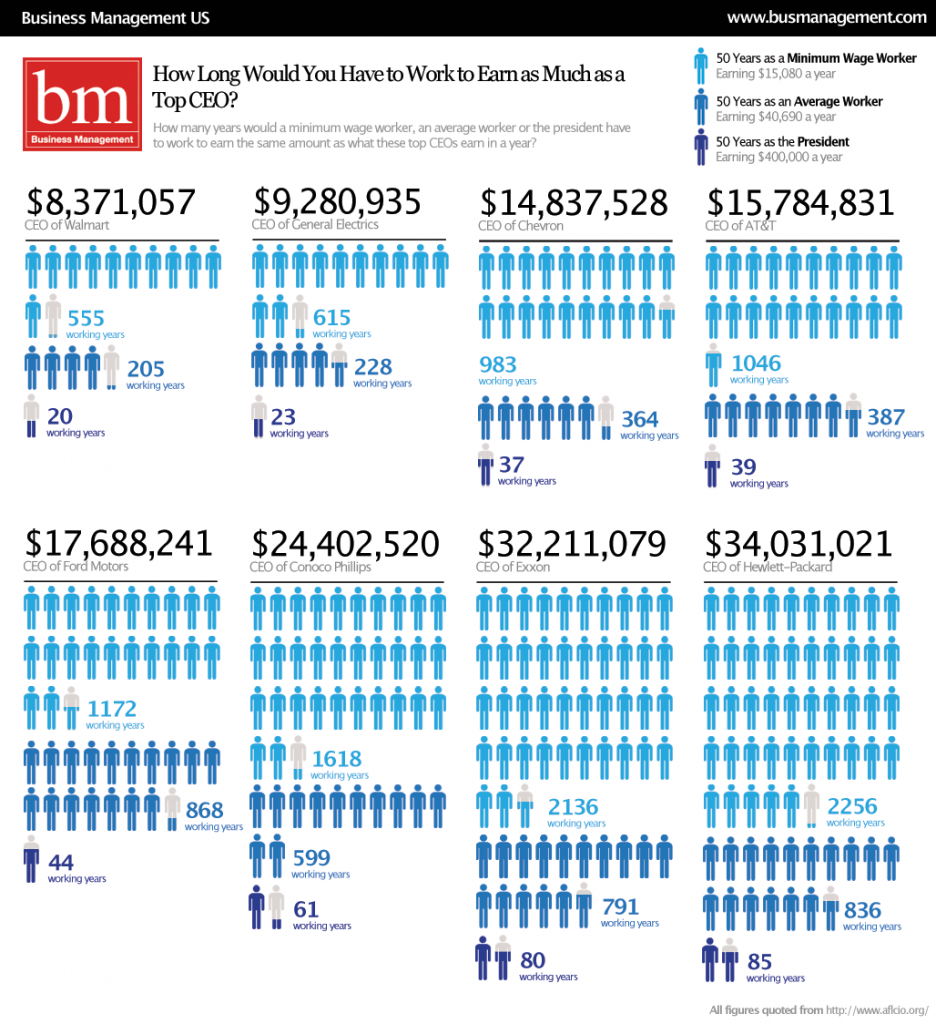
Business Management offers this great visual for understanding income in equality in the U.S.  Each light blue figure in this visual represents 50 years of work at minimum wage (making $15,080 a year); the medium blue figures represent 50 years of work at the average wage (making $40,690 a year); the dark blue figures represent 50 years as the President of the United States (making $400,000 a year).
090915-BMUS-PayRise2

Let’s take the most dramatic example, just for fun: Hewlett-Packard.

Capture

A minimum wage worker would have to work for 2,256 years to make what what the CEO of Hewlett-Packard makes in a year.

The average worker would have to work 836 years to match his yearly salary.

And Barack Obama would have to President for 85 years before he made what the CEO of Hewlett-Packard makes in one year.

See other posts on income inequality here, here, here, here, and here.

Via Chartporn.

—————————

Lisa Wade is a professor of sociology at Occidental College. You can follow her on Twitter and Facebook.


Stephen W. sent in an amazing 9-minute cartoon touting the superiority of capitalism:

—————————

Lisa Wade is a professor of sociology at Occidental College. You can follow her on Twitter and Facebook.

From FiveThirtyEight, showing the percentage answering “more” to the question “Providing health insurance for people who do not already have it–should the federal government spend more on it, the same as now, less, or no money at all?” in a 2004 poll. Note that the colors show deviation from the U.S. average, which was 73% answering “more”; brown indicates lower support, turquoise is higher support:

healthcare2004-StateAgeIncome

Not surprisingly, higher income correlates with lower support for more spending to cover the uninsured. The lower support among those over age 65, compared to other age groups, is sort of fascinating given that they themselves benefit from government spending on health programs that provide them coverage. But then, given that I’ve seen photos of people holding signs saying “keep the government out of Medicare,” I don’t know why I think people on Medicare would support public health insurance in general.

Of course, these numbers have likely changed now that the health care issue is getting so much coverage and publicity.


In the early 1980s the Reagan Administration engaged in an active campaign to demonize welfare and welfare recipients. Those who received public assistance were depicted as lazy free-loaders who burdened good, hard-working taxpayers. Race and gender played major parts in this framing of public assistance: the image of the “welfare queen” depicted those on welfare as lazy, promiscuous women who used their reproductive ability to have more children and thus get more welfare. This woman was implicitly African American, such as the woman in an anecdote Reagan told during his 1976 campaign (and repeated frequently) of a “welfare queen” on the South Side of Chicago who supposedly drove to the welfare office to get her check in an expensive Cadillac (whether he had actually encountered any such woman, as he claimed, was of course irrelevant).

The campaign was incredibly successful: once welfare recipients were depicted as lazy, promiscuous Black women sponging off of (White) taxpayers, public support for welfare programs declined. The negative attitude toward both welfare and its recipients lasted after Reagan left office; the debate about welfare reform in the mid-1990s echoed much of the discourse from the 1980s. Receiving public assistance was shameful; being a recipient was stigmatized.

Abby K. recently found an old Sesame Street segment called “I Am Somebody.” Jesse Jackson leads a group of children in an affirmation that they are “somebody,” and specifically includes the lines “I may be poor” and “I may be on welfare”:

(Originally found at the Sesame Street website.)

I realized just how effective the demonization of welfare has been when I was actually shocked to hear kids, in a show targeted at other kids, being led in a chant that said being poor or on welfare shouldn’t be shameful and did not reduce their worth as human beings. Can you imagine a TV show, even on PBS, putting something like this on the air today? Our public discourse at this point says that being on welfare is shameful, and that those receiving it in fact aren’t “somebody.” They are dependents, lazy loafers, and their kids are just additional burdens on the state; they don’t have the same rights to dignity and respect as other citizens, and they certainly shouldn’t expect to get it.

Of course, the totally confused looks on some of the kids’ faces are hysterical.

Let’s say that you work in an office with several people, and everyone is expected to meet certain performance standards. You’re an outstanding performer, considered one of the best in the firm. A couple offices down from you is a guy named Wendel, and you feel sorry for Wendel because he’s not quite able to meet the performance standards and is always teetering on the edge of losing his job. Your sense of Wendel is that he’s a good guy who just never gets the right breaks, and if he were given more chances to succeed he could probably pull himself out of his slump.

One day, you’re working on a project team with Wendel and notice that he’s screwed up a major report bigtime—big enough that he’s sure to get fired if anyone else sees it—but so far only you have seen it and you have a brief opportunity to cover up Wendel’s mistakes. If you cover them up, in effect lying by passing off your work as Wendel’s, you’ll probably get away with it and Wendel will go on to work another day. If you don’t, he’s finished.

What will you do?

We normally associate acting dishonestly with causing harm to others, but it’s also quite possible that a dishonest act can help someone, like Wendel.  Under what conditions we’re prone to act dishonestly to hurt or help another is what a new study in the journal Psychological Science investigated.

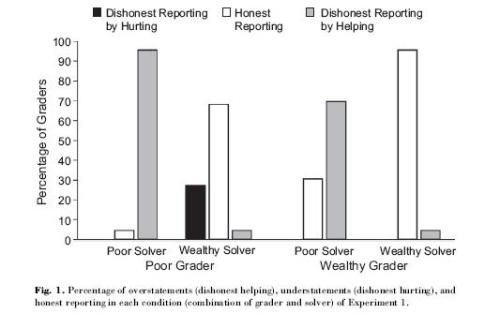
Researchers created a mock scenario in which study participants were randomly assigned to one of two roles: solver or grader. Each solver was also randomly assigned to a grader. Participants in both roles became either ‘‘wealthy’’ or ‘‘poor’’ through a lottery in which they had a 50% probability of winning $20. This lottery, together with the random pairing of solvers and graders, created four pair types: wealthy grader and wealthy solver; poor grader and poor solver; wealthy grader and poor solver; and poor grader and wealthy solver. After the lottery, solvers solved multiple anagrams. Graders then graded solvers’ work. Graders had the opportunity to dishonestly help or hurt solvers by misreporting their performance. If a grader overstated a solver’s performance, then the solver earned undeserved money. If the grader understated the solver’s performance, then the solver did not earn deserved money.

The results: When a wealthy grader was assigned to a poor solver, the grader overwhelmingly misreported the score to help the solver (about 70% of the time). When a wealthy grader was assigned to a wealthy solver, the grader nearly always reported the score honestly (90%).  On the other side of the coin, when a poor grader was assigned to a poor solver, the grader nearly always misreported the score to help (95%). When a poor grader was assigned to a wealthy solver, however, the grader misreported the score negatively to hurt the solver about 30% of the time. A graph of the results is below.

Graph

The reasons for these results, the researchers surmise, are less about financial self interest and more about emotional responses to inequity.  Individuals increase their dishonest hurting behavior and reduce their helping behavior when they are worse off than the other person.  Conversely, they increase dishonest helping behavior when they are better off than the other person.

What we seem to be back to with this study is the realization that we’re not so rational after all.  Dishonesty, in either direction, appears to be motivated by emotional reaction more than rational evaluations of self interest – at least in the context of relatively small sums of money (it would be interesting to see what would happen if we jacked the amount up a few hundred bucks).

So, not to forget about Wendel – how’d he make out in your mind?

Source: Gino, F., & Pierce, L. (2009). Dishonesty in the Name of Equity Psychological Science DOI: 10.1111/j.1467-9280.2009.02421.x

—————————-

David DiSalvo is a science and technology writer who regularly blogs at Neuronarrative and Brainspin on the True/Slant network. He is also a freelance writer for Scientific American Mind magazine.

If you would like to write a post for Sociological Images, please see our Guidelines for Guest Bloggers.

We’ve collected many images of the gendering and sexualization of food, where foods are turned into sexy female bodies or are shown alongside sexy women. Miriam sent us a link to Brick House Tavern & Tap, which markets itself as a Hooters-lite for-the-guys restaurant. The menu includes some sexualized elements, and is based on a clear gendering of items. Clearly it’s objectifying women (check out the website), but what interests me is the message we get about masculinity.

There are salads for men and women; the male version includes two types of meat and boiled egg:

Picture 1

Men are supposed to control things; foods are described as dominant or submissive. I presume the “man-cave” dish would fall into the dominant category:

Picture 2

Men’s foods are unhealthy. Steamed, rather than fried, options? Those are for the ladies:

Picture 3

Real manliness is associated with guns:

Picture 4

UPDATE: Reader Lisa says,

I thought the “gun show” reference was to biceps – e.g. men have muscles and women don’t. (e.g. Do you have your tickets to the gun show? har har har)

That makes total sense. I’ve had the good luck to never have heard that particular joke until now.

There’s also a class element:

Picture 5

And desserts are “the happy ending,” with “double d” cupcakes and “sweet, innocent” (girl)-next-door apple crumble:

Picture 6

It’s a common theme (see Lisa’s post on frozen dinners): real men need big meals with lots of meat. They don’t worry about health–they want you to deep-fry everything, dammit! Trying to eat a healthy, low-fat diet is for women. And foods are depicted as parts of women’s bodies (“double d”) or associated with sex (“the happy ending”).

See also Campbell’s ad saying beef soup is for men only.

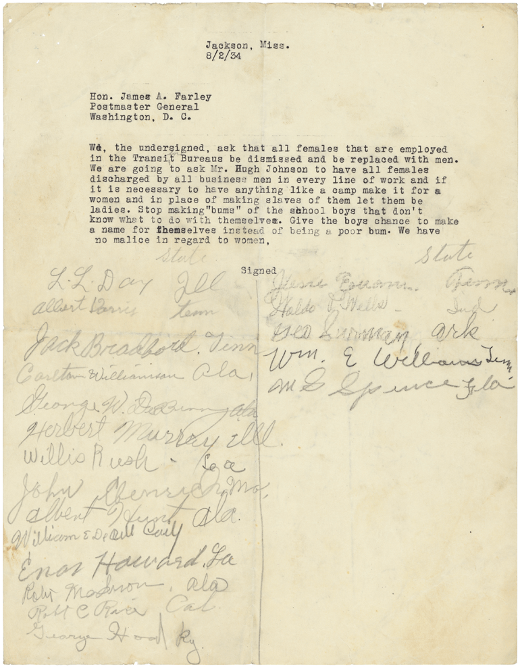
Ryan A. sent in this image of a letter (found at Letters of Note) sent to the Postmaster General in 1934, in which men ask for women to be fired so that men can have jobs:

4013497117_be9b6c7448_o

Notice that work is depicted as an oppressive burden for women (“…in place of making slaves of them let them be ladies”). Men, on the other hand, are entitled to take employment from women if they are in need of it to avoid being “bums” (and apparently it’s ok to make slaves of them).

Now, don’t get me wrong: I actually have sympathy for the psychological distress these and other men must have felt at the time. When manhood is highly associated with the ability to support a family on your income alone, job loss and poverty is not just embarrassing, it is a threat to your very identity as a man. The plea for jobs to help young men “make a name for themselves” is partly a call to let them become responsible adult men in good social standing, rather than bums (a term loaded with moral judgment).

So I have sympathy for the men struggling with the feeling of failure that came with joblessness. But it’s still noteworthy that the letter indicates a sense of entitlement to women’s jobs (much like veterans returning from World War II felt toward women who had taken jobs outside the home). Women, presumably, had a husband to support them and it was his duty to not be a bum so that she wouldn’t need to take a job from another man.

In the U.S. today, men enroll in college at a lower rate and drop out at a higher rate. In 2005, there were 57 women on campus for every 43 men.

This is such a significant problem, that college admissions officers are letting in a larger percentage of male applicants, even sometimes admitting less qualified men over more qualified women.

But this isn’t just a gender story.

A USA Today story offered this data from the ACE Center for Policy and Analysis:

Capture

Looking at the very bottom line of the table (and just at 2003/2004), you can see that the gender gap is largest among lower income students.  Men make up 40% of undergraduates 18-24 when you consider low-income students only, and 49% when you look at upper income students.

The gender gap also correlates with race.  Asian students show the smallest gender gap, whites the next smallest, with Hispanics and blacks trailing.

You might notice that the correlation of the gender gap with race mirrors the class correlation.  That is, income and wealth data for racial categories follows the same pattern with Asians out earning whites (categorically speaking) and whites out earning Hispanics and blacks.  So there may be an interesting exacerbation effect here.

The gender gaps for each racial/ethnic group, however, decreases as the students’ families get richer.  And, among the upper income groups, the racial difference shrinks to only three percentage points (from 11 among low- and middle-income kids).

So, it’s not just about race, it’s not just about class, and it’s not just about gender.  Then, what is it about being poor, black or Hispanic, andmale that results in low male enrollment in college and a higher drop out rate?

—————————

Lisa Wade is a professor of sociology at Occidental College. You can follow her on Twitter and Facebook.