class

Whether you are in college or not, fall semester 2011 is upon us. Below, courtesy of Everyday Sociology, is a graph illustrating the rising cost of college, controlled for inflation.

Public College/University Tuition, Room and Board (held constant in 2007-2008 dollars):

Consequent to this increase, the average student in 2008 graduated with twice the debt as a student in 1996, from $12,750 to $23,200.

The pay-off of a college education, however, is higher than ever. So why don’t more people go?

In the seven-and-a-half minute video below, UC Berkeley Professor Michael Hout gives a history of higher education putting all of this in perspective. The answer is class-specific and how different classes think about debt and possibility. More:

Lisa Wade, PhD is an Associate Professor at Tulane University. She is the author of American Hookup, a book about college sexual culture; a textbook about gender; and a forthcoming introductory text: Terrible Magnificent Sociology. You can follow her on Twitter and Instagram.

We have posted a number of times about the unequal effects of the current economic crisis: the worsening of the racial gap in homeownership, the more severely negative economic situation of African Americans and Latinos than of Whites, including among African American and White college graduates, higher unemployment for men than for women (this post also has a lot of info about race, sex, and job loss), the fact that older workers who lose their jobs remain unemployed longer than younger workers, that job losses have been accompanied by increased corporate profits, and that wealthier households have weathered the crisis better than less prosperous ones.

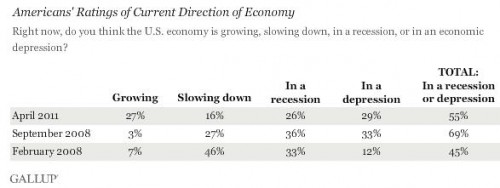
Dmitriy T.M. sent along an April 2011 Gallup poll that asked 1,013 Americans about their perceptions of the economy. Overall, results were more positive than when the same question was asked in September 2008, when the economic meltdown really became apparent. Though more than half of respondents said the U.S. is in either a recession or a depression, that’s down significantly from the 69% who said so in late 2008, while the 27% who said the economy is growing is an enormous jump compared to the mere 3% who thought it was in September 2008:

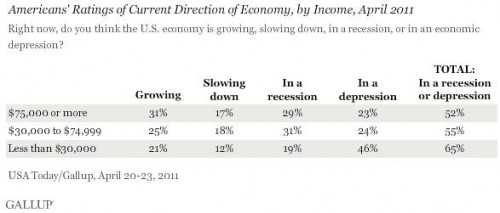
But perceptions of the economy differed significantly by income level. Nobody thought it was doing great; over half of every income group still thought the economy was in either a recession or a depression. However, those making less than $30,000 a year had a notably more negative outlook on the economy than those with higher incomes. Not only were they more likely to think the economy is doing poorly, but nearly half thought we’re experiencing a depression — twice as high as the proportion of those making $75,000/year who thought so:

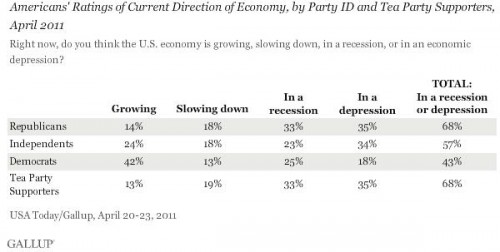
Interestingly, perceptions of the economy also varied widely by political affiliation, with Democrats feeling much more positive about the economy than any other group, and Republicans and Tea Party supports feeling markedly more negative:

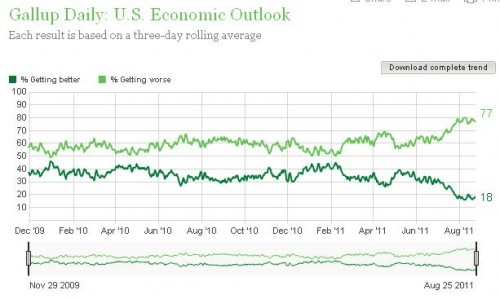
Meanwhile, the Gallup daily tracker poll on the state of the economy (which only shows overall results) shows a marked downturn in Americans’ perceptions of the economy throughout the summer of 2011, with 77% now reporting the economy is “getting worse”:

For more on the economic crisis and its uneven effects, see Philip Cohen’s post on race and job loss, differences in optimism about the future, unemployment by race/sex/education, occupation, median earnings, and race, and the geography of job loss.

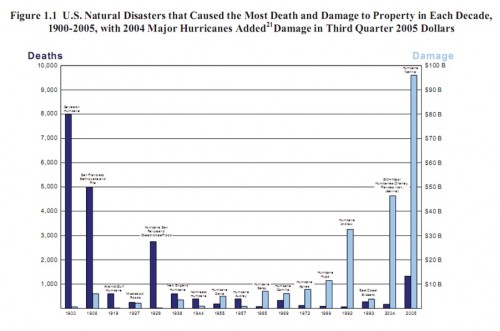
Presidential hopeful and U.S. Congressman Ron Paul (R-TX) made the news over the weekend arguing, among other things, that the Federal Emergency Management Agency (FEMA) is unnecessary or, even worse, creates a kind of moral hazard in populations who come to depend on Federal relief efforts. In remarks reported Friday, Rep. Paul said that Hurricane Irene should be handled “like 1900,” the year that a large storm killed approximately 8,000 individuals in Galveston and a few thousand more onshore, when it struck the low-lying island and nearby small communities on the Texas coast.

It is certainly true that the Federal response to the destruction of Galveston was relatively minor. Systematic Federal management and provision of aid to individuals in disaster crystallized in response to the Mississippi River’s catastrophic flooding in 1927.  In 1900, it was limited for the most part to President McKinley sending surplus Army tents to house the newly homeless residents of Galveston, and loaning some ships to transport relief goods.

The nation as a whole, on the other hand, quickly mobilized relief donation efforts through newspapers, state and city governments, and the dense network of fraternal organizations that characterized American civil society in 1900. The nation’s response was along the lines of the civic and political institutions of the time, with all that entailed.

[Credit: Rosenberg Library’s Galveston and Texas History Center archives]

So, for instance, some of the citizens of Galveston who survived the storm were given liquor for their nerves and pressed into service at gunpoint by local authorities to clear dead and putrefying bodies from the wreckage; some were later partially compensated for their time with a small sum of money. Property owners, however, were exempted from mandatory clearing of debris and corpses.

Voluntary associations – often segregated by gender, race, ethnicity, and class – took care of their own members as best they could, but the broader distribution of relief supplies arriving from other areas was handled by committees of Galveston’s social and economic elites, based on their knowledge of their city’s political districts. Distribution efforts throughout the Texas coast were controversial enough that hearings were held by the Texas State Senate to investigate reports of improper relief distribution, some of which were borne out by testimony but none of which were pursued.  Survivors’ letters suggest that in some cases the nicer relief goods – the distribution of which was handled by committees of Galveston’s social and economic elites on the basis of what they knew about their city’s political districts – went to the wealthier victims’ districts, when they weren’t re-routed by less wealthy and somewhat disgruntled Galvestonians tasked with actually lugging the supplies around the city.  And Galveston’s African-American community was wholly shut out of the rebuilding process and denied a seat on the Central Relief Committee, despite efforts to secure a place in helping shape the collective destiny of the city. This is hardly surprising: poorer Americans tend to suffer disproportionately in most disasters, and are often left out of planning and rebuilding efforts.

There is much to be said for the response of Galveston’s Central Relief Committee. Under their leadership the city built the seawall that helps protect the city to this day and they initiated a series of successful municipal reforms that became widespread during the Progressive era. But we should not let unexamined nostalgia blind us to the realities of the situation in Galveston in the months after the 1900 storm.

Nor should we forget that the techniques that might have been more or less appropriate in 1900 were attuned to a society that has since changed quite a bit. It would be hard to imagine contemporary Americans pressed into service to clear bodies, barring a truly exceptional event. And despite its shortcomings, American culture is on the whole more egalitarian in 2005 than it was in 1900.

But the dense network of associations through which much assistance flowed to the city simply does not exist in the contemporary U.S. for a variety of reasons, none of which are reducible to the growth of the Federal government.  Instead, Americans support each other in crises by way of donations to highly professionalized and technically adept disaster relief organizations like the Red Cross, and by maintaining government organizations charged with preparing for the worst disasters and catastrophes with their tax dollars.

This makes sense in part because contemporary cities and the economic arrangements which undergird them are much more complex beasts than they were in 1900. The following chart property damage and deaths caused by major disasters over the 20th century:

[Source: The Federal Response to Hurricane Katrina: Lessons Learned, p. 6.]

The overall trend is toward less lethal but much costlier disasters, which in turn causes significant disruptions to the ordinary functioning of local businesses and municipal governments that depend on tax revenues from those businesses. This necessitates more Federal involvement, as cities and state governments struggle to get their own houses in order, and to pay for the resources and technical know-how needed to rebuild infrastructure, modern dwellings, and businesses. As Lawrence Powell, a historian at Tulane University in New Orleans, asked of the influx of well-meaning volunteers in response to Katrina, “Can the methods of a nineteenth-century barn raising drag a twenty-first-century disaster area from the mud and the muck?”.

The 20th century history of Federal disaster policy can be described as a cycle of expansion and contraction. Increasingly complex disasters draw forth ad hoc solutions, which are then formalized and later institutionalized until they grow unwieldy and are periodically consolidated in efforts to provide more efficient, systematic, and effective services that are less prone to fraud or waste.

Small and big business, social movement organizations, academics, professionals, voluntary associations and NGOs have all helped shape the trajectory of that cycle, as when civil rights organizations successfully lobbied Congress and the Red Cross after Hurricane Camille in 1969 to provide a baseline of minimum assistance to hurricane victims, rather than the older policy that granted aid on the basis of pre-disaster assets (and which thus tended to favor wealthier victims on the basis that they had lost more than had the poor).

In recent decades, this has tended toward deregulation of coastal development in deference to free market ideals and a Congressional movement in the mid 1990s that sought to pay for disaster relief by, in large part, cutting social service programs that serve the poor. (See Ted Steinberg’s Acts of God for one good historical and political economic critique of U.S. disaster policy.)

How Federal disaster mitigation efforts can be more efficient, just, or effective is certainly a worthy conversation to hold. How best to arrange – and pay for – social relationships around economic, ecological, and technological risk is also an excellent topic for deliberation and debate. But to seriously argue that we should strive to make our disaster response regime more like that enjoyed by Americans in the early half of the twentieth century is, for lack of a better word, silly.

(For that matter, it’s hard to understand what Rep. Paul means by his call for more control by the States; the decision to request the involvement of the Federal government and FEMA already rests with the State governors, as per the Stafford Act.)

Former generations of Americans saw a patchwork of state government solutions as inadequate to managing modern disasters, particularly those that overwhelm municipal or State governments. They built Civil Defense agencies, the Office of Emergency Preparedness, and later FEMA in an effort to combine accountability and economies of scale and expertise, and to ensure that in times of disaster Americans could count on their Federal government to marshal tools and talent when local and State governments are overwhelmed and help is asked.

And as my own research shows, the efforts of these state organizations have long been understood by victims and outside observers alike as expressing and relying on bonds of fellow citizenship and civil solidarity. That in recent decades this legacy has been tarnished with cronyism and mismanagement from above says more about those political actors and the institutions of American electoral politics than it does about the inherent worth of Federal disaster management organizations.

——————————

Brady Potts is a lecturer in the Department of Sociology at the University of Southern California. His current research focuses on the history of public discourse and narratives around risk and hurricane disasters, and the role of civic culture in American disaster response.

If you would like to write a post for Sociological Images, please see our Guidelines for Guest Bloggers.

Cross-posted at Reports from the Economic Front.

The mainstream media works hard to convince us that Republicans and Democrats are locked in heated battle, with each side advocating dramatically different economic policies.  Although there are differences between the two sides, members of both parties generally share common ground in opposing any fundamental changes to the workings of our economy.

A recent International Monetary Fund report on the U.S. economy sheds light on why this is so.  The report includes the following four color-coded charts which compare economic recoveries (including our current one) according to various criteria (each recovery is along the left; criteria of recovery are along the top; red = weakest recoveries, green = strongest recoveries).

imf-us.jpg

As you can see from the red boxes in the first chart (the one titled “Real GDP and components”), our last two recoveries have been quite weak compared with previous recoveries in terms of growth in GDP, personal consumption, and investment in nonresidential structures.  This indicates a growing problem with our economic fundamentals.

The red boxes in the second chart (”Households and employment”) indicate that our last two recoveries have also not been kind to working people as measured by the growth in nonfarm payrolls, unemployment, and disposable income.

However, things look quite different in the last two charts. The green boxes in the third chart (”Business sector”) make clear that the last two expansions have generally been good for nonfinancial corporations.  And the dark green boxes in the fourth chart (”Financial”) highlight the enormous gains made by financial corporations in the last two expansions, and especially the current one.

The take-away from these charts is that business leaders experience our recent recoveries very differently than do the great majority of people.  Despite the fact that growing numbers of workers find it hard to distinguish our expansions from our recessions, business profits keep climbing.  And that is what matters to business. Not surprisingly, then, our corporate leaders are lobbying our political leaders hard not to change existing economic arrangements.  If some austerity is needed to maintain stability–so be it.  And, this lobbying has proven successful.

The connection between deteriorating economic and social conditions and high corporate profitability deserves careful study as does the question of whether this is a stable relationship. Regardless, these charts provide important insight into our national policy-making nexus.  As long as our large corporations are prospering we should not expect our political process to produce meaningful change.  The problem isnt a lack of good ideas for how to strengthen our economy and generate jobs, it is the lack of interest on the part of our elected leaders — on both sides of the aisle — to seriously consider them.  It appears that meaningful economic change will have to await either a further unraveling of our economic and social infrastructure or the rise of a powerful social movement with a new economic vision.


Katrin let us know about this great clip from PBS News Hour (and posted at Boing Boing) about inequality and Americans’ perceptions about how wealth is distributed in the U.S. It’s a great clip:

PBS posted the pie charts used in the video as well.

The U.S. economy is in trouble and that means trouble for the world economy.

According to a United Nations Conference on Trade and Development report, “Buoyant consumer demand in the United States was the main driver of global economic growth for many years in the run-up to the current global economic crisis.”

Before the crisis, U.S. household consumption accounted for approximately 16 percent of total global output, with imports comprising a significant share and playing a critical role in supporting growth in other countries.

…as a result of global production sharing, United States consumer spending increas[ed] global economic activities in many indirect ways as well (e.g. business investments in countries such as Germany and Japan to produce machinery for export to China and its use there for the manufacture of exports to the United States).

In short, a significant decline in U.S. spending can be expected to have a major impact on world growth, with serious blow-back for the United States.

There are those who argue that things are not so dire, that other countries are capable of stepping up their spending to compensate for any decline in U.S. consumption. However, the evidence suggests otherwise.As the chart below (from the report) reveals, consumption spending in the U.S. is far greater than in any other country; it is greater than Chinese, German, and Japanese consumption combined.

consumption.jpg

Moreover, there is little reason to believe that the Chinese, German, or Japanese governments are interested in boosting consumer spending in their respective countries.  All three governments continue to pursue export-led growth strategies that are underpinned by policies designed to suppress wage growth (lower wages = cheaper goods = stronger competitiveness in international markets).  Such policies restrict rather than encourage national consumption because they limit the amount of money people have to spend.

For example, China is the world’s fastest growing major economy and often viewed as a potential alternative growth pole to the United States.  Yet, the Economist reveals that the country’s growth has brought few benefits to the majority of Chinese workers.

picture1.jpg

According to the U.S. Bureau of Labor Statistics, despite several years of wage increases, Chinese manufacturing workers still only earn an average of  $1.36 per hour (including all benefits).  In relative terms, Chinese hourly labor compensation is roughly 4 percent of that in the United States.   It even remains considerably below that in Mexico.

Trends in Germany, the other high-flying major economy, are rather similar. As the chart below shows, the share of German GDP going to its workers has been declining for over a decade.  It is now considerably below its 1995 level.  In fact, the German government’s success in driving down German labor costs is one of the main causes of Europe’s current debt problems — other European countries have been unable to match Germany’s cost advantage, leaving them with growing trade deficits and foreign debt (largely owed to German banks).

germany.jpg

The Japanese economy, which remains in stagnation, is definitely unable to play a significant role in supporting world growth.  Moreover, as we see below, much like in the United States, China, and Germany, workers in Japan continue to produce more per hour while suffering real wage declines.

japan.gif

For a number of years, world growth was sustained by ever greater debt-driven U.S. consumer spending.  That driver now appears exhausted and U.S. political and economic leaders are pushing hard for austerity.  If they get their way, the repercussions will be serious for workers everywhere.

Our goal should not be a return to the unbalanced growth of the past but new, more stable and equitable world-wide patterns of production and consumption.  Achieving that outcome will not be easy, especially since as the United Nations Conference on Trade and Development’s World Investment Report 2011 points out, transnational corporations (including their affiliates) currently account for one-fourth of global GDP.Their affiliates alone produce more than 10 percent of global GDP and one-third of world exports.  And, these figures do not include the activities of many national firms that produce according to terms specified by these transnational corporations.   These dominant firms have a big stake in maintaining existing structures of production and trade regardless of the social costs and they exercise considerable political influence in all the countries in which they operate.

Cross-posted at Montclair SocioBlog.

I am a Londoner. A proud East Londoner, hailing from the working class. And this past week has been one of the most difficult I’ve encountered since I moved to the US nearly ten years ago.  This weekend my hometown was attacked by rioters, just minutes away from my family’s homes and businesses, my high school and a million childhood and teenage memories.  I don’t think I can do justice describing the feeling of watching this unfold from so far away.  Needless to say, I wouldn’t wish the experience on anyone.  Thankfully, it would appear that most of the violence has subsided. In its place: a myriad of social commentaries on why this happened.  Not only from journalists, but from the everyman benefitting from the very same social media that helped rioters coordinate.  Indeed, many sociologists have aired their ideas on Facebook, blogs and even op-eds.

But perhaps in our rush to explain and apportion blame perhaps we all missed asking some important questions.  Why did we assume that the rioters are poor?  How do we really know the class background of the rioters?  Why did the media depict the rioters as underprivileged? And why did we accept this depiction unquestioningly?

The sociologist in me fantasizes of a post-riot 10 question survey to be distributed to all rioters immediately after completion of law breaking activities with questions including: what is your average household income, what is your and your parent’s highest level of education, what is your occupation, on a scale of one to ten just how angry with the government are you at this moment, ten being really jolly pissed off?


Short of such a research tool, how did we come up with generalizations of a group of people we really know little about, except for the fact that they all rioted?

As someone who has lived in both nations, I feel class is certainly a nuanced thing in Britain, much more so than in the US. But even with the subtleties of the British system you cannot simply see class.  And for the most part, all the information we initially had about rioters is what we saw on TV and in still photographs.

We just cannot tell.  If you thought you could tell, you’d be guessing, and you’d be basing your decision on ideas you have about the poor.  Some might point to history; past rioters have tended to be from the working classes. But this only offers us the ability to make a prediction. But, most commentaries did not acknowledge that they were predicting who was involved.  Some might argue that those wearing hoodies are poor, as the wearing of hoodies has become synonymous in the British press with certain low-income groups.  But people of all class groups own hoodies.  We also cannot surmise simply from a picture that the rioters were from the area they attacked and attempt to extrapolate social class from that location.  Indeed, early police reports indicate that in some cases there was organized travelling to targeted areas and in my home borough of Waltham Forest, initial records show that more than half of those arrested did not live there.  So how do we ascertain the social class of the rioters?  Their behavior?

Did we see violence, looting and vandalism and assume that this could only be the work of poor people, and passively accepted the media’s categorization of the perpetrators as such?  Or are we so blinded by our ideological beliefs, romanticizing the riots to be exactly what Marx warned us of that we bought this generalization? Or do we want so desperately to blame governmental cuts against the poor that we ignore the lack of solid evidence as to who these rioters really are?  Or did we simply map on our understanding of other riots, and assume that all rioters are the same?  I don’t have the answer to these questions, but think it is worth considering why we made the assumptions we did about the rioters when we had little to no data.

As I write this, on Friday 12th August, long after many of the commentaries have been published and opinions have been shared, news outlets are beginning to report the demographic information of the rioters who have appeared in court. (Go here and click on “Get the data”; sorry for the broken link earlier!)

Among those rioters who fit the stereotype  — alienated, poor youth — are those who do not fit this type at all. They have already been the subject of several headlines: teachers, an Olympic ambassador, a graphic designer, college graduates and a “millionaire’s daughter.”  The very fact that these “unusual suspects” have been singled out by the press demonstrates the power of this prejudice; we are shocked when it isn’t poor people rioting.  But why? Is it because deep down we believe that the poor are capable of violence, but the rich aren’t? Or is it because this riot is more complex than simply the rage of downtrodden people?

At this point, we are far from really knowing the class backgrounds of the rioters, especially since many people have not, and probably will not, be caught for their actions. We are still without reliable data to draw conclusions, just as we were earlier in the week when so many of us rushed to attribute this rioting to disenfranchised youth. I am not arguing that class won’t be an important factor in our understandings of these riots, and it may well be that these riots were mostly poor people. But my point is we cannot say with certainty at this moment in time that this is the case. And as an East End girl, I ask: what does it say about us, especially sociologists, that we were so willing to believe this about the poor without any solid data?

UPDATE: Kat provided a link to some data that wasn’t available when the post was being written. The Guardian mapped the home addresses of those arrested in the riots; the results indicate that they appear to have been disproportionately, though not solely, from areas that are poor — and getting poorer. Of those arrested, for instance, 41% came from the top 10% of areas when ranked by levels of deprivation.

Faye Allard is an Assistant Professor of Sociology at Montclair State University.  When not busy winning teaching awards, she is working on a book about the African American gender gap in high school educational achievement, called “Mind the Gap.”

Photography projects can draw our attention, poignantly, to class inequality.  Consider Vivian Mayer’s vintage photographs of New York and Chicago, for example, or Peter Menzel’s What We Own series.  We need these projects because most of us are in class-segregated occupations and neighborhoods, not to mention a profoundly unequal world.

Photographer James Mollison has embarked on a similar project, Where Children Sleep, sent in by Kristina Killgrove, an anthropologist at Vanderbilt University, Yvette M., Amanda B., Dmitriy T.M., and my sister, Keely.  Mollison has documented children and their bedrooms around the world.  It’s heartbreaking to see how much some children have, and how little others do.


See the pictures, with details about the children, at the New York Times.

Lisa Wade, PhD is an Associate Professor at Tulane University. She is the author of American Hookup, a book about college sexual culture; a textbook about gender; and a forthcoming introductory text: Terrible Magnificent Sociology. You can follow her on Twitter and Instagram.