class


My colleague and co-author, Lisa Wade (you’d know her better as one of the people behind SocImages), gave a seven-minute speech at an Occupy Teach-In at our shared institution, Occidental College.  She said I could post it for you.

In the video she says she’s optimistic about the movement because it’s deeply sociological, drawing our attention to the way we organize our society, not just the individuals in it.  She contrasts this ability to critique the system with the early years of the Great Depression, during which many of the unemployed felt like they had failed their families because of personal faults (leading to a rise in the suicide rate).  Then, using the truly inspirational story of the 1955 Montgomery bus boycott (in which people walked to work and rode carpools for over a year!), she warns students that the movement is about to stop being fun and require real commitment. She ends by asking the the audience whether they can rise to the occasion and make the sacrifices needed to move Occupy forward to achieve specific demands.

Also see the three-minute bit on hook up culture that she did for MTV Canada.

Cross-posted from Family Inequality.

The Congressional Budget Office has a new report on trends in the income distribution. The big news is the 1%’s blitzkrieg assault on equality.*

The headline image will be this one, which shows the changing share of after-tax-and-transfer household income. Every group except the top 1% had a smaller share of income in 2007 than they did in 1979, or just an equal share in the case of the 81st-99th percentile group. That means the gains in the top quintile are all concentrated in the top 1%.

That is very important and a source of outrage for the hundreds of thousands of Facebook users posting, commenting, or “liking” Occupy Wall St. and its related pages.

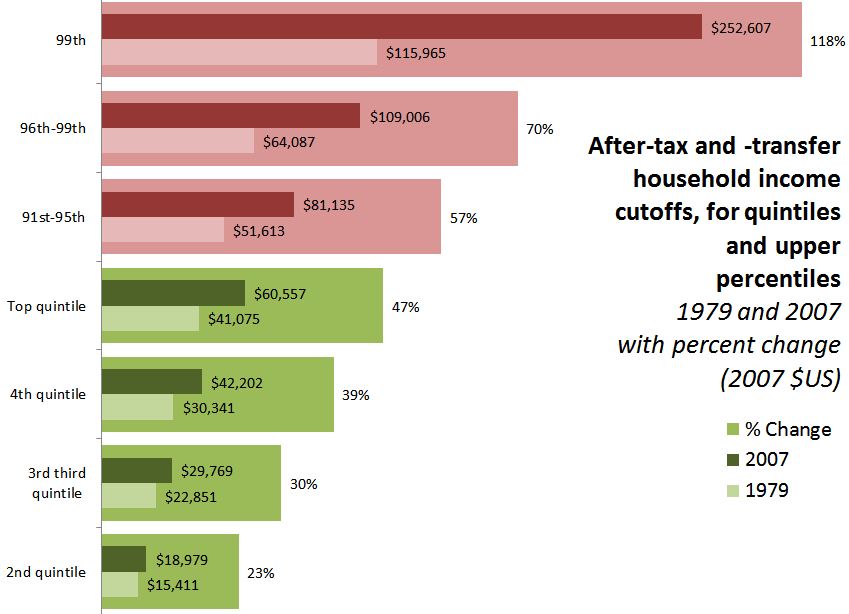
But it would be misleading to view the chart as showing that incomes fell for the other groups, since it shows shares of the total income. Income growth has been very skewed toward the top, but it is by no means confined to the top 1%. Here is my graph showing the income cutoffs for each quintile, and for the top slices separately. These are the cutoffs in 1979 and 2007 (in inflation-adjusted dollars), with the percentage change in the backgrounded bars.

(Note there is no lower cutoff for the bottom quintile — the price of entry for that group is always $0).

Two thoughts about this.

  • Even if there were no 1%, if the graph only included the green bars, there would be plenty of increasing inequality for what might then be called “the 80%” to protest. The 81st-99th folks may be lucky to have the popular anger directed at the grotesque opulence of the sliver above them. (I’m not diminishing the extremity of the gains for the top 1%, but, as Matt Taibbi describes, the object of opposition is not just their income, but their influence.
  • If you look at the families and networks of the top 1%, how many of them have relatives, friends, and even co-“workers” who are only in the top 10%? Would a self-respecting 1% family be appalled if their son married someone from a stable 5%-er family?

What I’m wondering is whether the 1% folks are merely a statistical convenience rather than a socially cohesive group (dare I say, class?). That’s an empirical question that national income distributions can’t necessarily answer.

*I should mention that the report is not just another rehash of Census numbers, though. Two adjustments they made seem especially good. First, they used a tricky matching method to combine Current Population Survey numbers (which do better at benefits and low-income households) combined with Internal Revenue Service data (which is better for high-end data). Second, they adjusted for household size and composition, and calculated distributions before and after taxes and transfers, and among different kinds of income. The report is here, a summary is here, and the blog post version is here.

To add to our coverage of sketchy Halloween costumes and the social significance of costume themes Ann K., Dolores R., Tessa S., Zeynep A., and occasional guest blogger Brady Potts all sent in an opinion column that ran in the New York Times on Friday about a costume party at Steven J. Baum, a law firm near Buffalo, NY. Steven J. Baum specializes in representing banks and mortgage companies as they attempt to foreclose on homes and evict the residents; according to the NYT piece, it is the largest such firm in New York, representing clients such as Bank of America and JP Morgan Chase.

Apparently the company has a big annual Halloween party, with employees encouraged to dress up and the office elaborately decorated. In 2010, the theme in one department was…mocking people who are losing their homes. Part of the office was decorated as “Baum Estates,” a set of foreclosed-upon homes, and some employees dressed up as residents of homes in foreclosure, whom they depict as dirty, pathetic, booze-loving liars. Part of the room was decorated as foreclosed homes; the sign says “Foreclosure Sale.”

Recently I posted about Philip Zimbardo’s research on conformity and the ways that seemingly normal people become involved in horrible acts, and I think his research has some relevance here. It’s possible these employees are all openly mean-spirited, callous people who lack compassion, and that they were like that before they got to Steven J. Baum. But more likely, they are reacting to a corporate culture that gives clear signals that this type of attitude and behavior is acceptable. Indeed, according to the NYT article,

When we spoke later, [the former employee who sent the photos] added that the snapshots are an accurate representation of the firm’s mind-set. “There is this really cavalier attitude,” she said. “It doesn’t matter that people are going to lose their homes.” Nor does the firm try to help people get mortgage modifications; the pressure, always, is to foreclose.

For these employees, there’s going to be a powerful motivation to view people being foreclosed upon as lying, stupid cheats. Day after day, your job is to help kick people out of their homes. Your workplace has made it clear that the preferred outcome is always to foreclose, not to help people get loan modifications that might allow them to stay in their homes. Your job, by definition, requires you to not try to help people, even when they have legally-guaranteed options available.

Given that situation, belittling the homeowners, dehumanizing them, thinking of them as just stumbling blocks who cause you headaches with their complaints that you haven’t followed proper procedure, their efforts to legally block the foreclosure proceedings, their various attempts to avoid becoming homeless…those seem like unsurprising outcomes encouraged as part of the corporate culture, and job requirements, described at Steven J. Baum.

—————————

UPDATE: It appears that Steven J. Baum PC has folded in the aftermath of this scandal.  Reports Globe St.:

New York’s largest foreclosure firm, Steven J. Baum PC, has announced “mass layoffs,” signaling that the firm is closing its doors. The move followed recent decisions by Fannie Mae and Freddie Mac to stop referring new cases to the embattled firm.

Gwen Sharp is an associate professor of sociology at Nevada State College. You can follow her on Twitter at @gwensharpnv.

The Pew Project for Excellence in Journalism reports that coverage of the economy went up in October:

Overall economic coverage accounted for 22% of the newshole from October 3-9, up from 14% the week before (when it was No. 2).

(The word “newshole” refers to the limited space/time devoted to news in a day.)

Coverage of the protests is rising too, suggesting that Occupy Wall Street can take at least part of the credit:

The protests [themselves]… constituted the largest single thread in that coverage, making up about one-third of the economic storyline. That amounted to roughly 7% of the overall newshole, or nearly four times the amount of protest coverage from the week before.


So, is Occupy Wall Street also changing the discourse?

Jeremiah sent a link to data collected by Think Progress that suggests it is.  They counted the number of times MSNBC, CNN, and Fox used the terms “unemployed,”  “unemployment,” and “debt” during the last week in July, before the protests began.  They found that news coverage emphasized the debt (and the need to cut spending to reduce it) much, much more than the fact that there were large numbers of unemployed people (who would be helped by spending).

During the week of October 10-16, though, the language was different.  News coverage talked about the protests themselves, and the problem of jobs for the unemployed. The specter of the debt is now taking a back seat to the suffering of individuals.

It’ll be interesting to see what happens.

Lisa Wade, PhD is an Associate Professor at Tulane University. She is the author of American Hookup, a book about college sexual culture; a textbook about gender; and a forthcoming introductory text: Terrible Magnificent Sociology. You can follow her on Twitter and Instagram.

In this video the always-fantastic Jay Smooth, of Ill Doctrine, spends just over four minutes offering his perspective on the Occupy Wall Street movement.  He likes it. And, he says, more importantly, the media coverage and treatment of the protests is telling us a lot about who’s in bed with who, politically speaking.

Lisa Wade, PhD is an Associate Professor at Tulane University. She is the author of American Hookup, a book about college sexual culture; a textbook about gender; and a forthcoming introductory text: Terrible Magnificent Sociology. You can follow her on Twitter and Instagram.

Graphic Sociology linked to a study by the Office of the State Comptroller aiming at understanding the importance of the securities industry to New York City’s economy.  It reveals something we already know quite well — that compensation to financial services sector workers is extraordinarily high (~350,000/year) — but also that the relative compensation of financial services sector workers, compared to the average worker in New York City, has increasingly advantaged the former.

This figure, included in the report, shows just how disproportionately compensation in the finance sector has been growing compared to compensation for everyone else.  While workers in other private sectors have seen their incomes about triple since 1981, workers in securities are making, on average, eight to ten times what they were making 30 years ago.  This means that, while people in finance made about twice what the average worker made in 1981, they now make about six times the income of the average private sector worker.

Lisa Wade, PhD is an Associate Professor at Tulane University. She is the author of American Hookup, a book about college sexual culture; a textbook about gender; and a forthcoming introductory text: Terrible Magnificent Sociology. You can follow her on Twitter and Instagram.

Social justice scholars and activists suspect the recent push by many states to require government issued photo identification at the polls is a de facto strategy to suppress voter turnout amongst the poor.

The work of Symbolic Interactionist Michael Schwalbe helps us understand how prejudices like these institutionalize themselves in our democracy.  Powerful elites always define themselves as intellectually and morally superior to lower class others.   In viewing themselves as the guardians of our republic, these elites view it their personal responsibility to protect our democracy from the undue and corrosive influence of the poor who are implicitly thought unworthy of democratic rights.  For example, elites argue the poor are likely to succumb to what congressional Republican Paul Ryan describes as “the good politics and rotten economics of class warfare.”  By constructing the poor as contaminating our democratic process, restraints on voting are justified and rationalized.

In a satirical critique of a 2006 New York Times editorial about how many other Western democracies have gone to great lengths to maximize voter turnout, comedian Stephen Colbert draws upon the supposed intellectual and moral superiority of the wealthy to explain why America should only encourage the rich to vote “because they must know something, they got all that money.”  Colbert argues that we should keep the disadvantaged from the polls “because the poor don’t have much to offer democracy.”  By revealing the class prejudices many hold about both the wealthy and the poor, Colbert uses satire to reveal the real logic driving changes in how we vote.

————————

Jason Eastman is an Assistant Professor of Sociology at Coastal Carolina University who researches how culture and identity influence social inequalities.

If you would like to write a post for Sociological Images, please see our Guidelines for Guest Bloggers.

Cross-posted at Thick Culture.

The Occupy Wall Street protests have garnered a great deal of attention in recent weeks. The core argument is that the “top one percent” has gotten a free ride in the last few decades, particularly during the last few years where the financial sector has seemingly not been held to account for their role in the financial crisis. But who is the “top one percent”?

Suzy Khimm on Ezra Klein’s blog sheds light on this question.

You’d be in the top 1 percent of U.S. households if your income in 2010 was at least $516,633. Your net worth in 2007 was $8,232,000 or more, and your average income this year is $1,530,773.

Khimm also shares some charts from Dave Gilson that looks deeper into who these “1 percenters” really are. In this chart, he notes that those in the top one percent have a broad range of professions. You’ll note from the chart than only 14 percent come from the financial sector, and a scant 2 percent are classified as “entrepreneurs.” As a side note, how did any professors make this list (1.8 percent)!

This data doesn’t play into the story the “99 percenters” want to tell about the “top 1 percent.” The preferred narrative is that the top one percent come from the financial sector (e.g. their wealth is not earned in the same way an entrepreneur’s wealth is earned).

But another of Gilson’s charts does help the 99 percenter’s story. According to this chart, the top one percent owns a majority share of the nation’s stock/mutual funds, securities, and business equity) when compared to the “bottom 90 percent.”

What does this say about the validity of the Occupy Wall street movement? Should they be focusing their efforts on challenging concentrated wealth regardless of whether it is in the financial sector or not? Or is Wall Street the perfect villain?  Does it matter if the story of who constitutes the “top 1 percent” is more muddled if the objective is met? Do the means justify the ends?

——————————

Jose Marichal, PhD, is an assistant professor of political science at California Lutheran University. He teaches and writes about: public policy, race and politics, civic engagement, the Internet and politics, and community development.  He is founder of the blog ThickCulture.

If you would like to write a post for Sociological Images, please see our Guidelines for Guest Bloggers.