class

Cross-posted at Ms.

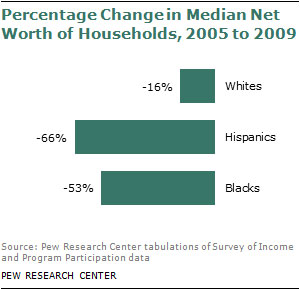
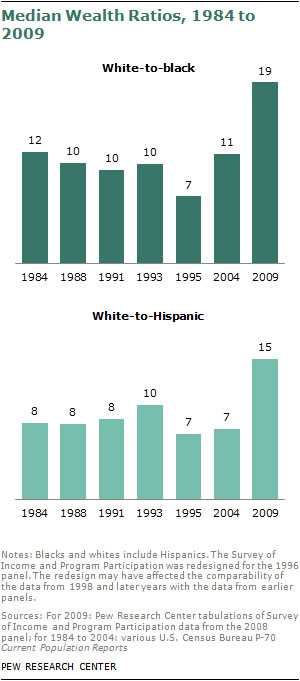
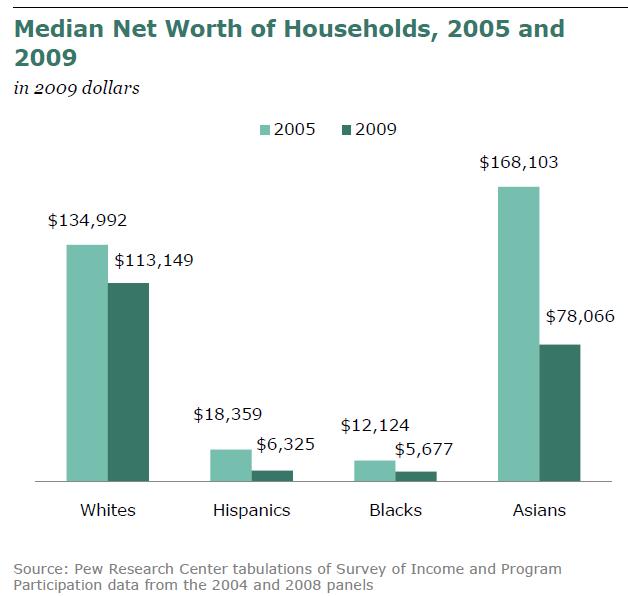
A new study from the Pew Research Center reports staggering racial gaps in median wealth — a person’s accumulated assets minus her debt — between whites ($113,149), blacks ($5,677) and Latinos ($6,325). That’s a 20-to-1 white-to-black ratio of wealth and a 18-to-1 white-to-Latino ratio.

Essentially, all of the economic gains made by people of color since the Civil Rights Movement have been erased in a few years by the Long Recession. Whites experienced a net wealth loss of 16 percent from 2005 to 2009, while blacks lost about half of their wealth (53 percent) and Latinos lost two-thirds of their wealth.

Media outlets reporting on the Pew study point to housing loss as the primary culprit, since the net worth of blacks and Latinos is heavily reliant on home ownership, while whites are more likely to have retirement accounts and stock.

While this is certainly accurate, it obscures the core racism at play. Public policy decisions have been responsible for the speedy recovery of the financial market and the slow recovery of the housing market. From the start, the Troubled Asset Relief Program (TARP) favored Wall Street recovery over homeowner recovery, with only $12 billion of the $700 billion bailout spent on foreclosure programs. (To be fair, most of the Wall Street money was eventually paid back.)

So prioritization of corporate interests disproportionately assisted whites in the recovery — but (perhaps) not intentionally. The same cannot be said for actual lending practices.

Rampant– — and racist — fraud in the home loan industry was a primary contributor to the collapse, with 61 percent of sub-prime loan holders actually qualifying for prime loans that would have been easier to maintain. Blacks and Latinos were especially targeted for sub-prime loans, a practice called “reverse redlining.” Wells Fargo loan officer-turned-whistle blower Elizabeth Jacobson admitted that her company specifically went after African Americans for sub-prime loans through “wealth building” conferences hosted in black churches.

The employment gap between whites and blacks is also a contributor to the wealth gap. While white American are suffering through the Long Recession with 7.9 percent unemployment, blacks are experiencing Great Depression-like figures of 16.1 percent unemployment. This figure jumps to 31.4 percent for blacks ages 16 to 24, and black Americans have consistently had the higher rate of unemployment compared to white Americans since 2007.

Not surprisingly, the employment gap, too, has racist origins. The Center for American Progress analyzed unemployment data from the last three recessions and found that black unemployment starts earlier, rises faster and lingers longer. Explanations include the concentration of black workers in the stumbling manufacturing sector, the cutting of public sector jobs — and racial discrimination. This last finding is no shock given that employers are more likely to call back a white job applicant with a criminal record than a similarly qualified black man without a record.

The role of racism in poverty is important to keep in mind at a time Washington politicians are manufacturing crises that will slash the entitlement programs that 1 in 6 Americans rely on. It’s ironic that we’re cutting safety nets for the poor just as we’re experiencing the highest poverty rate since 1960, with blacks and Latinos three times as likely to live in poverty. Public policy is supposed to knock down racial and other non-meritorious barriers to pursuing life, liberty, and happiness, not jack them higher.

The Pew Research Center just released an analysis of 2009 government data on the wealth gap between White non-Hispanics, African Americans, and Hispanics, and it’s pretty depressing. It’s not just that the gap is so large, but also that Hispanic and African American households have such low median worth in absolute terms (p. 13 in the report):


A quarter of Hispanics and Blacks have no assets other than a vehicle, compared to 6% of Whites. And 35% of Black and 31% of Hispanic households had negative median net worth in 2009, with their debts outweighing all of their assets; this was true of only 15% of White non-Hispanics.This is partially because African Americans and especially Hispanics were disproportionately hit by the effects of the housing crisis, the single largest source of reduced wealth. Overall, those two groups have suffered a much more dramatic loss in assets than Whites (sorry, Asians weren’t included in all the images, and Native Americans aren’t included in any):

The result is a wealth gap that is the largest it has ever been since the government began making such data available in the early ’80s. White non-Hispanics have nearly 20 times higher median wealth than Blacks, and 15 times as much as Hispanics:

For more details, check out the full report. The implications of these disparities, and the low levels of financial assets available to African Americans and Hispanics compared to Whites, is truly stunning.

Last week I posted the results of a survey that found that many beneficiaries of government programs don’t recognize themselves as participating in a federal program at all. For instance, 60% of respondents who have written off their mortgage interest on their taxes didn’t see that as a government benefit or themselves as program beneficiaries. Basically, programs and policies that are disproportionately used by the middle- and upper-classes are taken for granted. I wrote,

…allowing you to write off mortgage interest (but not rent), or charitable donations, or the money you put aside for a child’s education, are all forms of government programs, ones that benefit some more than others. But the “submerged” nature of these policies hides the degree to which the middle and upper classes use and benefit from federal programs.

Brian McCabe, over at FiveThirtyEight, recently wrote a post about who benefits from the mortgage interest tax deduction program, which remains enormously popular among the general public. McCabe says,

Commentators often talk about the mortgage interest deduction as a prized middle-class benefit that enables households to achieve the American dream of homeownership. But despite their strong support for the deduction, middle-class Americans are not the primary beneficiaries of this federal tax subsidy.

If you aren’t familiar with the program, basically when you’re doing your taxes, you are allowed to reduce your taxable income by subtracting the amount you paid in mortgage interest that year. Home ownership isn’t treated equally — the tax deduction is worth more as the price of the home, and thus the amount of interest paid, goes up. McCabe points out that in 2009, this program meant that the federal government took in about $80 billion less than it would have otherwise, making it one of the most expensive tax policies and the single most expensive deduction offered to homeowners (much more than deductions for putting in energy-efficient windows, etc.).

But this expensive program is disproportionately used by relatively wealthy individuals. For instance, about a quarter of taxpayers making $40,000 – 50,000 a year claim the deduction, while over 75% of those making above $100,000 a year do:

The differences in usage is partly because the wealthy are more likely to own* homes. In addition, those with lower incomes generally buy cheaper houses and often find that they reduce their taxable income so little by writing off the mortgage interest that they’re better off taking the standard tax deduction than to itemize.

Because wealthier individuals are more likely to use the program at all, and when they do, generally have more mortgage interest to deduct, the benefits of the program go disproportionately to those with higher incomes. This image shows the proportion of all tax filers that fall into each income category, and the proportion of the total tax deduction benefit that goes to each category:

This is similar to what we see with farm subsidies: while small- and mid-sized farms benefit, the money spent on the program disproportionately goes to the largest farms.  The mortgage interest deduction program is discussed as a method for helping the middle-class achieve the American Dream of homeownership. And certainly it does make home ownership more attractive to many middle- and lower-income individuals. But it overwhelmingly benefits upper-income home buyers, at a significant loss of tax income for the federal government.

* On a side note, I find it odd that we say someone “owns” their home when they owe a mortgage on it. The second I signed a mortgage last year, I entered the much-praised category of the home-owning citizen. Yet as my mortgage-hating farm family has made me very aware, I’m not even close to truly owning my home at this point; I’m more of a special category of rent-to-own resident whose landlord is the bank or mortgage company.

Cross-posted at Montclair SocioBlog.

Is the SAT biased?  If so, against who is it biased?

It has long been part of the leftist creed that the SAT and other standardized tests are biased against the culturally disadvantaged – racial minorities, the poor, etc.  Those kids may be just as academically capable as more privileged kids, but the tests don’t show it.

But maybe SATs are biased against privileged kids.  That’s the implication in a blog post by Greg Mankiw.  Mankiw is not a liberal.  In the Bush-Cheney first term, he was the head of the Council of Economic Advisors.  He is also a Harvard professor and the author of a best-selling economics text book.  Back in May he had a blog post called “A Regression I’d Like to See.” If tests are biased in the way liberals say they are, says Mankiw, let’s regress GPA on SAT scores and family income.  The correlation with family income should be negative.

…a lower-income student should do better in college, holding reported SAT score constant, because he managed to get that SAT score without all those extra benefits.

In fact, the regression had been done, and Mankiw added this update:

Todd Stinebrickner, an economist at The University of Western Ontario, emails me this comment:

“Regardless, within the income groups we examine, students from higher income backgrounds have significantly higher grades throughout college conditional on college entrance exam . . . scores.” [Mankiw added the boldface]

What this means is that if you are a college admissions officer trying to identify the students who will do best in college, as measured by grades, you would give positive rather than negative weight on family income.

Not to give positive weight to income, therefore, is bias against those with higher incomes.

To see what Mankiw means, look at some made-up data on two groups.  To keep things civil, I’m just going to call them Group One and Group Two.  (You might imagine them as White and Black, Richer and Poorer, or whatever your preferred categories of injustice are.  I’m sticking with One and Two.)  Following Mankiw, we regress GPA on SAT scores.  That is, we use SAT scores as our predictor and we measure how well they predict students’ performance in college (their GPA).

In both groups, the higher the SAT, the higher the GPA.  As the regression line shows, the test is a good predictor of performance.  But you can also see that the Group One students are higher on both.  If we put the two groups together we get this.

Just as Mankiw says, if you’re a college admissions director and you want the students who do best, at any level of SAT score, you should give preference to Group One.  For example, look at all the students who scored 500 on the SAT (i.e., holding SAT constant at 500).  The Group One kids got better grades than did the Group Two kids.  So just using the SATs, without taking the Group factor (e..g., income ) into account, biases things against Group One.  The Group One students can complain: “the SAT underestimates our abilities, so the SAT is biased against us.”

Case closed?  Not yet.  I hesitate to go up against an academic superstar like Mankiw, and I don’t want to insult him (I’ll leave that to Paul Krugman).  But there are two ways to regress the data.  So there’s another regression, maybe one that Mankiw does not want to see.

What happens if we take the same data and regress SAT scores on GPA?  Now GPA is our predictor variable.  In effect, we’re using it as an indicator of how smart the student really is, the same way we used the SAT in the first graph.

Let’s hold GPA constant at 3.0.  The Group One students at that GPA have, on average, higher SAT scores.  So the Group Two students can legitimately say, “We’re just as smart as the Group One kids; we have the same GPA.  But the SAT gives the impression that we’re less smart.  So the SAT is biased against us.”

So where are we?

  • The test makers say that it’s a good test – it predicts who will do well in college.
  • The Group One students say the test is biased against them.
  • The Group Two students say the test is biased against them.

And they all are right.

————————

Huge hat tip to my brother, S.A. Livingston.  He told me of this idea (it dates back to a paper from the1970s by Nancy Cole) and provided the made-up data to illustrate it.  He also suggested these lines from Gilbert and Sullivan:

And you’ll allow, as I expect
That they are right to so object
And I am right, and you are right
And everything is quite correct.

Cross-posted at Montclair SocioBlog.

In Sunday’s Times, David Leonhardt, who usually patrols the economics beat, looks at fashions in baby names. His primary focus is the rapid decline in old-fashioned names for girls. The “nostalgia wave” of Emma, Grace, Ella, and other late-nineteenth-century names, he argues, is over.

Well, yes and no. Sarah and Emma may be in decline, but the big gainer among girls’ names is Sophia, an equally nostalgic name that was last popular at the turn of the twentieth century. Isabella, too, (third largest gain) follows the same trend line. Besides, the nostaligia for old names was selective. Emma and Grace may have come back, but many other old-fashioned names never became trendy. One hundred years ago and continuing through the 1920s, one of the most popular girls’ names in the US was Mildred. (You can trace the popularity baby names at the Census website.)

“The lack of recent Jane Austen movies has probably played a role,” says Leonhardt, though he’s probably joking. Not only is Emma still in the top five, but I suspect that films of that persuasion appealed more to the prejudices and sensibilities of post-childbearing women. But the media do have an impact. In Freakonomics, Levitt and Dubner showed how fashions in names often trickle down. The Sophias and Isabellas become stylish first among the upscale and educated; it may be several years, even decades, before they became more widely popular. But the media/celebrity channel can bypass that slow trickle. As Leonhardt says, how else to explain the boom in Khloe?

Similarly, Addison, the second biggest gainer, may have gotten a boost from the fictional doctor who rose from “Gray’s Anatomy” to her own “Private Practice.” In the first year of “Gray’s Anatomy, the name Addison zoomed from 106th place to 28th. The name is also just different enough from Madison, which had been in the top ten for nearly a decade. Its stylishness was fading fast among the fashion-conscious.

Madison herself owed her popularity to the media. She created a big “Splash” soon after the film came out. As Tom Hanks says in the scene below, “Madison’s not a name.” (Stop at the punchline at 3:23 — “Good thing we weren’t at 149th street.” Transcript after the jump).

At the time, the Hanks character was correct. Before “Splash” (1984) Madison was never in the top 1000. The next year, she was at 600. Now she has been in the top ten for nearly fifteen years, and at number two or three for half those years. (There have not yet been any Madisons in my classes. I suspect that will change soon.)

Boys’ names seem governed by somewhat different rules, with less overall variation, though recent trends are towards names with a final “n” (four out of the five big gainers in the chart above) and Biblical names.

In short, these recent changes in girls’ names aren’t about nostalgia.   Name trends are like fashion trends, they come and go. And, like fashion, name trends can be media driven, especially now that media can short-circuit the slower class diffusion process.

Transcript of the Splash joke after the jump:

more...

Today the U.S. Supreme Court has announced that the female employees of  Walmart will not be allowed to bring a class action lawsuit against the company, arguing that it has not been shown that they are a class.  It would have been the largest employment discrimination suit in history.

It seems timely, then, to re-post our summary of some of the evidence against Walmart.  Women are, on average, paid less, are less likely to be salaried, and hold lower-ranked positions than men.  This is true even though there is less turnover among women, meaning that the average female employee has been working at Walmart significantly longer than the average male employee.

——————————

The U.S. Supreme Court is hearing arguments in the Dukes v. Wal-Mart suit. Wal-Mart is accused of egregious and systematic discrimination against the 1.5 million women who have worked there since 1998.  The case isn’t based on anecdotal accounts; instead, it’s backed up by reams of data.  Here is some of it.

Women in hourly and especially salaried jobs make less money than men:

Women are disproportionately in hourly jobs (instead of salaried jobs) in every district examined:

Women make less than men in every district examined:

Women dominate the lowest paying, lowest ranked jobs at Walmart, and are a smaller and smaller percentages of the workforce as you go up the pay/rank hierarchy (from right to left):

And this is true despite the fact that women have lower turnover and have, on average, been working at Walmart significantly longer:

Walmart isn’t fighting the data. They’re not claiming non-discrimination. Instead, they’re arguing that compensation should be restricted to the women directly named in the suit instead of the 1.5 million women who’ve worked there. In other words, they’re hoping that the judge will not grant “class action” status to the case. If he does, it will be the largest class action lawsuit in history.

Lisa Wade, PhD is an Associate Professor at Tulane University. She is the author of American Hookup, a book about college sexual culture; a textbook about gender; and a forthcoming introductory text: Terrible Magnificent Sociology. You can follow her on Twitter and Instagram.

A few weeks back, Forbes named Pittsburgh as the most livable city in the U.S. The description of the city talks about its “art scene, job prospects, safety and affordability,” and presents a picture of Pittsburgh as a city that has rebounded from both its industrial past and the current economic crisis to become a cultural and intellectual hotspot:

Forbes ranked cities based on unemployment, rates of income growth in the past 5 years, crime rates, cost of living, and cultural/artistic opportunities (according to Sperling’s Best Places Arts & Leisure Index). The final score is an average of the different elements, each of which are weighted equally, though I can’t help but think a lot of people might think some of those factors are more important in how they evaluate a location than others. Also, I have some reservations about rankings from Sperling’s Best Places, as they have a “manliest cities” ranking commissioned by Combos snacks that includes “sales of salty snacks/crackers” and deductions for “emasculating” criteria like sushi restaurants.

But I digress. As it turns out, this glowing report is only part of the story of Pittsburgh. The city also tops the charts in terms of African American poverty. African Americans in the region haven’t benefited from the economic turnaround Forbes discussed.

In light of this fact, Jasiri X, a rapper from Pittsburgh, wrote “America’s Most Livable City.” In the song (lyrics here) and video he questions who, exactly, the city is livable for, contrasting the image portrayed in the Forbes article with the region’s neglected and under-developed African American neighborhoods:

There are also three videos featuring Jasiri X interviewing residents of poor neighborhoods. All are worth a watch, but I think the best is the 2nd segment. A local resident discusses how what he sees as exaggerated media reports of the crime and danger in some areas — some created by well-meaning people trying to bring attention to the needs of the community by, he believes, playing up the bad aspects — served to justify abandoning Black neighborhoods in desperate need of economic opportunities:

For another discussion of very different experiences of economic crisis and recovery, see our guest post about Forbes ranking Stockton, CA, as the most miserable city in the U.S.

Thanks to Abby Kinchy for the link.

David Banks, who blogs at Cyborgology, let us know that Gawker has posted an anti-union video Target shows to new hires. Apparently as some Target stores have started carrying groceries, some grocery workers’ unions have made efforts to unionize some stores, a move that Target, along with its larger big-box sibling, Wal-Mart, finds very threatening. The video includes a lot of common arguments — we’re all a family here, the union just wants your dues, etc. — along with some I found more unusual:

Full transcript here.

What I found especially striking was the segment starting at about 3:10, where they argue we don’t need unions because, basically, they were so effective in the past, they already fixed everything! There’s no more child labor, you can get worker’s comp if you’re injured…what more could you need a union for? So on the one hand, today unions are useless, empty organizations that just take your money and give you nothing, but in the past, they were great. Presumably employers only had to be told once to clean up, and then for all time everything is fixed.

I also liked David’s point about the video’s use of the idea of communal vs. individual action. On the one hand, the video repeatedly stresses the rights of the individual and suggests that unions interfere with an individual’s ability to make their own choices (and implying that all union contracts are identical and will be imposed on workers, rather than the outcome of negotiations). But as David points out, the video includes rather contradictory messages about individual and collective action, with the union presented as the bad collective but Target as the good, familial, happy collective:

The video manages to seamlessly contradict itself: the company is a communal entity while simultaneously granting each individual total autonomy. The union does the opposite- it pressures you into collective action while you’re trying to be a neoliberal individual, and it makes you break away from the “Target Family” when they’re trying to be communal.

Target has often avoided the negative publicity aimed at Wal-Mart about labor practices, treatment of workers, and anti-union activity; I know when I was an undergrad back in the ’90s, and anti-Wal-Mart activism was one of the topics of the day, some of my friends and I thought that shopping at Target instead of Wal-Mart meant we were really doing something meaningful in terms of opposing bad labor practices. But as this video illustrates, Target has fairly similar labor policies to Wal-Mart, whatever you think of them, just with less global market power to throw around.