age/aging

Flowing Data presented a number of figures revealing data about life expectancy (via).  It is well known that women live longer than men in Western countries (to age 81 versus age 76), but this graph, displaying the probability of dying in any given year, caught my eye:

Capture

Men have a higher probability of dying than women in any given year starting (it looks like) at about age 55.  It’s a small difference (maybe 5 percentage points at its largest), but over time it adds up.  Until about age 112, when men and women die at the same rates.

Awesomely, even at 119, your chance of dying in the next year isn’t quite 100%.  And that goes for men and women alike.

Also interesting, life expectancy by state:

Capture1

—————————

Lisa Wade is a professor of sociology at Occidental College. You can follow her on Twitter and Facebook.

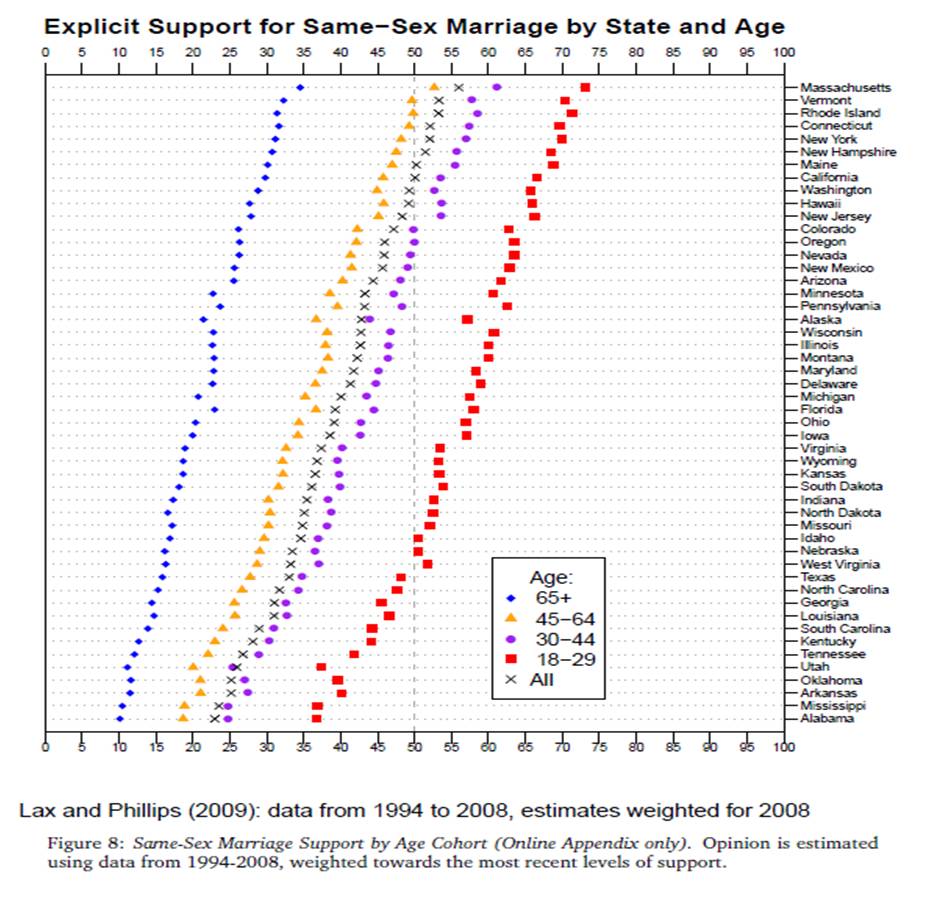
John L. sent in a link to a visual illustrating support for gay marriage by state and age:

age1

The data supports the notion that younger people are more supportive of gay marriage than older people. I also think it’s interesting that, even in states that we normally consider quite hostile to gay rights (the ones at the bottom of the table), there is still a significant age difference:  18-29 year-olds in Alabama, for example, are more supportive of gay marriage than people 65 and older in Massachusetts.  So, while we like to think about states as “liberal” or “conservative,” spreading out the data by age tells a much more complicated story.

For more data on support for gay rights, see here and here.

—————————

Lisa Wade is a professor of sociology at Occidental College. You can follow her on Twitter and Facebook.
Triathlon is the new Golf: As a young lawyer making a name for himself in the mid-seventies, my father’s superiors told him to “pick up golf” as a way to rise quickly within the firm, and to land lucrative clients. It’s still all about who you know, but if you want to get ahead in business today, don’t hit the putting green, sign up for an Ironman. Why?

Like Golf, Triathlon is cost prohibitive: The average annual income of an Ironman participant is nearly $160,000, while the average golfer makes a measly $100,980 a year, according to Golf.com’s 2009 Survey.

With Ironman entry fees upwards of $500 each (plus the flight and lodging expenses associated with destination racing), a decent bike starting around $3,000 (plus $400 for the shoes, helmet, peddles and accessories), $200 for swim, bike and run gear, and $300/month in coaching and facilities fees; you start to understand the need for that extra $60,000/year.

Triathletes make better business connections: Like Golf, Triathlon entrances “Type A” personalities, obsessed with winning, even if victory requires continuous practice and focus. Unlike golf, Triathlon also demands incredible pain tolerance and phenomenal endurance. Consequently, “the sport attracts high-income, driven, focused individuals who are able and willing to pay the price in time and money,” says David Samson, Florida Marlins president, and Hawaii Ironman 2006 finisher.

Not only are triathletes more driven, they’re also younger. On average, Ironman triathletes are 35-44, while avid golfers are generally in their early 50’s. Consequently, triathletes are at the peak of their professional careers, while many golfers are contemplating retirement, and thereby less effective in helping you infiltrate the network or company of your choosing.

Triathlon is a better way to schmooze (on a Micro Level): Now that you’ve drawn all of the rich, hard working, high powered individuals into one sport, it is time to make connections. Typically, only four players participate in a round of golf, which takes around 4.5 hours. You likely know at least one or two of the other competitors if you’ve been invited to play in the first place, so you’re left with at best two networking opportunities, which isn’t an efficient way to find the right contact for you.

Most of the Multi-Sport fitness groups in my home town (Marin County, CA), host weekly group rides, averaging thirty to fifty participants. The group usually covers seventy miles in a given ride, thereby providing five hours (plus a group brunch) to make friends, and connections. The group usually breaks into smaller packs of evenly matched athletes after a ten mile warm-up. As competitive, Type A folks, multiple members in a given group will eventually ask you how old you are, what team you belong to, and what you do (probably to ascertain how much time you have to train, how long you’ve been serious about the sport, who coaches you, and what if any advantage your bike may provide you).

It is during this hierarchical ranking process that you establish dominance over the somewhat older, not-as-fast man on the really expensive bike. He may be the CEO of a major tech company in Silicon Valley, but that is the professional “Pond” (Frank, 1987) or “Sphere” (Putnam, 1995). Right now, you’re both in the triathlon sphere, where you’re fitter, faster and had a better time at Ironman Canada last year. As Frank noted, it is relative status that creates happiness and satisfaction, and in this pond, your status is higher than his.

So, for the remainder of the ride (and during brunch afterward), he picks your brain about triathlon, and you arrange to have lunch with him at his office next week, a networking win you’d never enjoy if you’d attempted to engage said CEO in the professional Sphere.

Triathlon as a character reference: Not only have you now procured a meeting, you’ve already passed the first round of the interview process. The ability to withstand (and even enjoy) suffering is a form of ‘bonding social capital’ (Putnam, 2001) that forges a strong sense of collective identity. It implies a preference for achieving work-like goals in the leisure sphere, which translates seamlessly into a strong, professional recommendation from your new friend, the high powered CEO.

Triathlon is a better way to schmooze (on a Macro Level): There is no other sport in which every race includes Professional, Amateur and “Age Group” triathletes from under ten to over eighty, separated only by “wave” times, which are determined by age and gender. As Bob Babbitt, publisher of Competitor Magazine put it: “I can’t pitch to Barry Bonds or tee off with Tiger Woods, but I can be on the starting line with the top people in triathlon.” Consequently, you can train, compete and network with individuals of all ages and abilities, from around the world.

While the world of triathlon is growing rapidly (223,594 US adults participated in a triathlon in 2007, up from just 83,612 just ten years ago), Triathlon is still a small community, even at the Macro level. With a limited number of Ironman (2.4mi Swim, 112mi Bike, 26.2mi Run), Half Ironman (1.2mi Swim, 56mi Bike, 13.1mi Run), Olympic (.9mi Swim, 26mi Bike, 6.1mi Run) and Sprint (.5mi Swim, 16mi Bike, 2mi Run) distance races, you are assured to become familiar (and even friendly) with similarly matched athletes from across the country, and the world.

Triathlon is a reciprocal Panopticon: Your athletic club affiliations are declared on your uniform, and your age is written on your calf prior to each race (so you can check the legs of everyone you pass and everyone who passes you, to estimate ranking in on your age group during the actual race).

Your relative time and ranking is posted within minutes of completing the race, so all can see where you fall amongst the 2,000 or so athletes who participated that day. Award ceremonies are performed immediately, and results are posted online within 24 hours. You can even look up their participant’s photos!

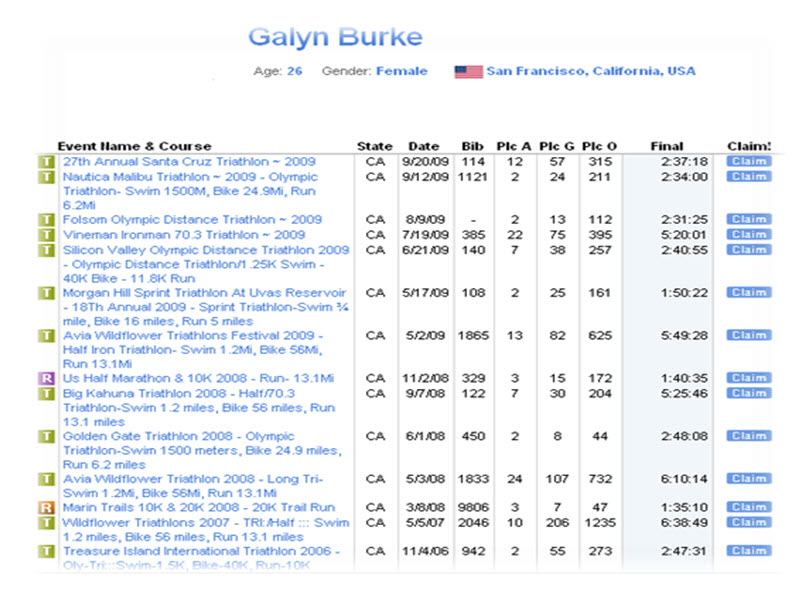
Basically, Triathlon is a Panopticon (Bentham 1995 [1785]; Foucault 1995 [1977]), in which everyone is given the role of prison guard and prisoner. You can’t hide anything about yourself, but in turn, you know everything about everyone else.

Athlink.com results display an athlete’s age, gender, city, and results for every event completed:

Athlink_Results_Image_4

Bentham’s Panopticon: A theoretical prison that allows guards to observe (-opticon) all (pan-) prisoners, who can’t reciprocally tell whether they are being watched:

Panopticon_Image_5

Conclusion: Triathletes are a self selecting group of affluent, highly motivated individuals, who spend countless hours forging bonds through the competitive, grueling, and socially cohesive ritual of endurance athletics. The greater community convenes several times a year to establish relative rank by sex, age, casual, amateur and pro standards. With access to the region, age, gender and past performances of every athlete in this group, Triathletes are “tee’d up” to make local, national and international connections that turn into husbands, wives (38% of Triathletes are now women), employees, employers and friends. In a world where it’s all about whom you know, it doesn’t hurt to know the rich, successful, driven group that is Triathlon.

References:

Bentham, Jeremy. 1995 [1785]. Panopticon Letters. Miran Bozovic (Ed.). London: Verso.

Foucault, Michel. 1995 [1977]. Discipline and Punish: The Birth of the Prison. New York: Vintage.

Frank, Robert. 1987. Choosing the Right Pond: Human Behavior and the Quest for Status. New York: Oxford University Press.

Putnam, Robert. 2001. Bowling Alone: The Collapse and Revival of American Community. New York: Simon and Schuster.

Galyn Burke–Brown, formerly a competitive equestrienne, is now an enthusiastic triathlete.   She blogs at Economic Sociology.

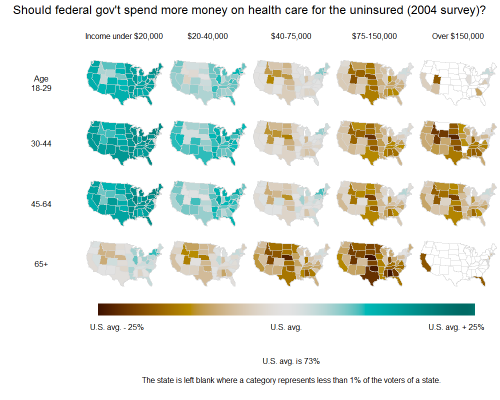
From FiveThirtyEight, showing the percentage answering “more” to the question “Providing health insurance for people who do not already have it–should the federal government spend more on it, the same as now, less, or no money at all?” in a 2004 poll. Note that the colors show deviation from the U.S. average, which was 73% answering “more”; brown indicates lower support, turquoise is higher support:

healthcare2004-StateAgeIncome

Not surprisingly, higher income correlates with lower support for more spending to cover the uninsured. The lower support among those over age 65, compared to other age groups, is sort of fascinating given that they themselves benefit from government spending on health programs that provide them coverage. But then, given that I’ve seen photos of people holding signs saying “keep the government out of Medicare,” I don’t know why I think people on Medicare would support public health insurance in general.

Of course, these numbers have likely changed now that the health care issue is getting so much coverage and publicity.

In the U.S., when people refer to the “traditional family,” they usually mean a family that they associate with the 1950s.  But the 1950s was a really unusual time in American history.  Elsewhere I’ve written about how the husband breadwinner/wife homemaker model is an American anomaly.  The data below, put together by the New York Times, shows that the 1950s was an unusual time in terms of age of marriage also:

Capture2

Though the data is rough (five points across 107 years), you can see a distinct dip in the age of marriage that includes the ’50s.

So history isn’t, as we often suppose, a straight line from one point to another.  It’s a complicated story.  And the 1950s… well, to choose that era as “traditional” is no more reasonable than to choose today or the enlightenment or the dark ages or…

Also see: everyone needs a wife and what does “traditional marriage” look like?

—————————

Lisa Wade is a professor of sociology at Occidental College. You can follow her on Twitter and Facebook.


Over at Everyday Sociology, Karen Sternheimer discussed one of Malcolm Gladwell’s arguments in his book, Outliers.  She explains:

While the American ethos of success suggests that it is the result of talent and hard work, Gladwell examines factors that sociologists refer to as social structure—things beyond our individual control—to understand what else successful people have helping them on their journey. Let’s be clear: skills and hard work are important, but so is timing.

One of the examples Gladwell uses is the strange concentration of wildly improbable success in birth cohorts (people born around the same time).  Sternheimer summarizes Gladwell’s argument as to how timing and geography shaped the ascendence of Gates and Jobs:

Gladwell describes how being born in the mid 1950s was particularly fortuitous for those interested [and talented] in computer programming development (think Bill Gates and Steve Jobs, both born in 1955). It also helped to be geographically near what were then called supercomputers, the gigantic predecessors to the thing on which you’re reading this post.

Sternheimer goes on to argue that members of Generation X may have a special advantage over earlier and later cohorts.  This figure shows that the number and rate of births peaked between the 1950s and then dropped precipitously during the period in which Generation X was born:

6a00d83534ac5b69e20120a5baf6b1970c

Those of us born in Generation X, then, would have had the advantage of schools designed and staffed for many more kids, leading to small class sizes and more resources for each kid.  Sternheimer writes:

As Gladwell describes, children born after booms… have the benefit of smaller class sizes. An unprecedented number of schools were built for Baby Boomers in the years before I was born. When my cohort was ready to go to school, there were newly-built buildings waiting for us, especially for people like me who lived in well-funded suburbs…

When I was in elementary school in the mid 1970s, there were so few students that many classes were combined: first and second graders had the same teacher, as did third and fourth graders. Looking back, this provided me with some unusual opportunities.

Being able to think through this intersection of biography and history is how C. Wright Mills describes as “the sociological imagination.”

—————————

Lisa Wade is a professor of sociology at Occidental College. You can follow her on Twitter and Facebook.
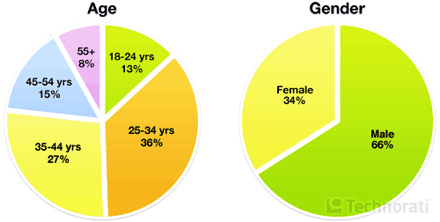
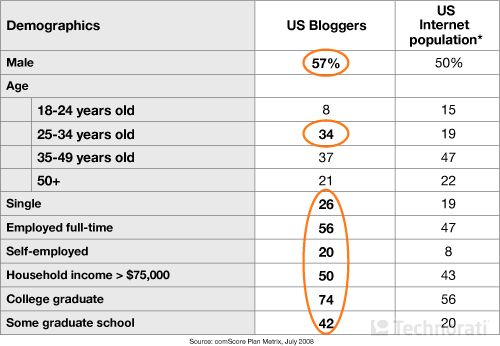
The answer to that question matters because, even if bloggers don’t have the ability to control what we think, they do, to a certain extent, shape what we think about.  And bloggers can sometimes make enough noise to be heard.

Kay Steiger drew my attention to the findings of a study of the blogosphere by Technorati.  Below are a selection of their findings, click over for more on who blogs and answers to other interesting questions:

3905002482_b7ef56e56f

chart-p1-location-2

chart-p1-salary

table-p1-usbloggers

—————————

Lisa Wade is a professor of sociology at Occidental College. You can follow her on Twitter and Facebook.

Jean Piaget, a psychologist who published his most influential works from the late 1920s through the 1950s, is most known for his theory of stages of cognitive development. He suggested a four-stage model that children go through as they develop more complex reasoning skills.

Children start out in the sensorimotor stage, which lasts until they’re roughly 2. They have no sense of themselves as individuals, obviously, and wouldn’t recognize their hand as “theirs.” They aren’t afraid of heights or touching something hot because they can’t grasp the idea of falling or something being hot–those ideas are too abstract.

Here’s a video that illustrates some of the limits of reasoning at this age:

In the preoperational stage (Piaget said it lasted from around age 2 until about 7), kids start being able to grasp symbols. For instance, they can draw a series of squares with a triangle on top to represent a house. They also start to learn the alphabet, which is, of course, the set of symbols we use to read and write.

On the other hand, they don’t understand abstract concepts like amounts, speed, or weight. In one of Piaget’s most famous experiments, he showed that children at this stage can’t comprehend that if you pour liquid from a short, wide glass into a tall, narrow glass, it’s still the same amount:

By the concrete operational stage (roughly 7-12 years old) kids comprehend ideas like weight, amount, and speed, and can understand that the amount of liquid in the two glasses is the same:

They can also understand causal relationships, though not necessarily explain the reasoning behind them. Here, the younger kid says what would happen if you hit a glass with a feather based on what he knows about feathers, whereas the older child reasons from the previous statement and answers according to the logic proposed (despite it being obviously inaccurate):

Finally, Piaget said that in the formal operational stage (after about age 12) kids can understand abstract concepts and reason logically. If you ask them what “justice” means, they can explain it. The girl in the last video, who reasoned from the previous statement (which had been presented as true), illustrates formal operational thinking.

Of course, there are questions about Piaget’s model (described in Kimmel and Aronson, 2009, Sociology Now). Do we really only go through each stage once? Might we have to go through some of them again when we hit new life challenges or milestones? Do we have to completely master one stage before we can progress, or is it possible to have some overlap? Are these stages universal? Would we expect childhood mental development to occur in the same way in a society where people are middle-aged by 20 as they would in one where they aren’t middle aged until 35 or 40? Might the fact that kids in some societies are given more “adult” tasks at a young age affect their mental development?

Of course, another issue comes up about the formal operational stage…Kohlberg and Gilligan (1971, “The Adolescent as Philosopher,” Daedalus, p. 1051-1086) estimated that about 30% of people in the U.S. never actually develop advanced abstract reasoning skills. I will make no further comment on that.

Gwen Sharp is an associate professor of sociology at Nevada State College. You can follow her on Twitter at @gwensharpnv.