age/aging

I schedule my posts for mid-morning, but I write most of them between midnight and 5am.  It’s 3:24am right now.

The New York Times developed an interactive graphic, based on data from the Bureau of Labor Statistics, that allows users to see what proportion of Americans are doing what at any given time of the day.

At about 3:24am, 95% of Americans are sleeping:

Capture

The interactive graphic allows you to look at the data by race, gender, parental status, education-level, employment, and age. Below are screen shots of the data for each age group.

People aged 15-24:

15

People aged 25-64:

Capture

People 65 and older:

Capture

Click overto play with the data. It’s oddly fascinating.

—————————

Lisa Wade is a professor of sociology at Occidental College. You can follow her on Twitter and Facebook.

Lisa recently asked, “What warrants a slide show on a newspaper’s website?” Denise L. sent in an article from the Life section of the Globe and Mail website called “Obsession with Aging Female Parts Has Created a New Body Lexicon” that brings up similar questions about what topics are given attention. The article states,

Ladies of a certain age, the best that can be said is, welcome. Congratulations are not necessarily in order…

Such is women’s obsession with the tyranny of their aging bodies – some might even call it a body dysmorphic disorder – that they develop names for the various age-signifying bits that can seem as offensive as teenage behaviour, prompting a need for strict control (in this case intervention in the form of diet, exercise, cream, injection or scalpel).

The names suggest annoyance, never love or fondness of the type men have for some of their parts.

Which is unfortunate. Don’t you love your teenager, despite his long, greasy hair? The cure, ladies, is to laugh. To wit, a list of the best names for the worst afflictions.

We then have images to illustrate aging and the names giving to aging body parts. Here are a few. Vampire Dinner Lips:

bodymap31lf1_151839artw

Quilting Pattern:

bodymap31lf2_151838artw

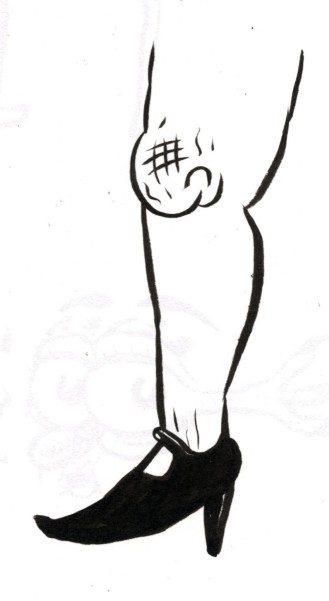
Suitcase Knees (because they’re “padded and bulky”):

bodymap31lf3_151837artw

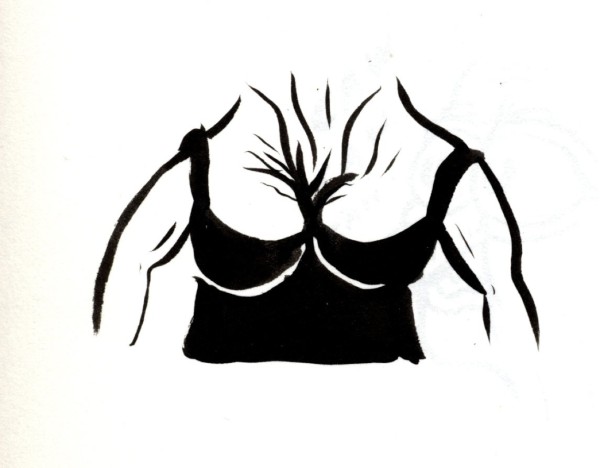
Crepey Cleavage (presumably looks like a crepe?)

bodymap31lf4_151835artw

Crow’s Feet:

bodymap31lf5_151834artw

Huh. I wonder why women don’t see to express “love or fondness” for their aging bodies the way the article claims many men do (something I find doubtful).

The article presents itself as an antidote to women’s obsession with their bodies and aging, a way to help women laugh and accept their bodies. But the images that accompany it, clearly meant to make the figures into objects of ridicule, make it hard to imagine how they would achieve such an objective. Reading it just made me aware of all kinds of things I’d never heard of or particularly noticed before. And in a larger sense, the question, as with the slide shows of scantily clad women, is why this is news? And why pretend the article is about helping women accept their bodies through humor, which I don’t think it does?

Amy Poehler, Sarah Silverman, Julie Lewis-Dreyfus Julia Louis-Dreyfus, Christina Applegate, Jane Krakowski, and Mary Louise-Parker candidly discuss getting older in Hollywood. The discussion starts about about 1:00. It’s not particularly organized, but it’s nice to hear perspectives from the inside:

Via Feministing.

—————————

Lisa Wade is a professor of sociology at Occidental College. You can follow her on Twitter and Facebook.

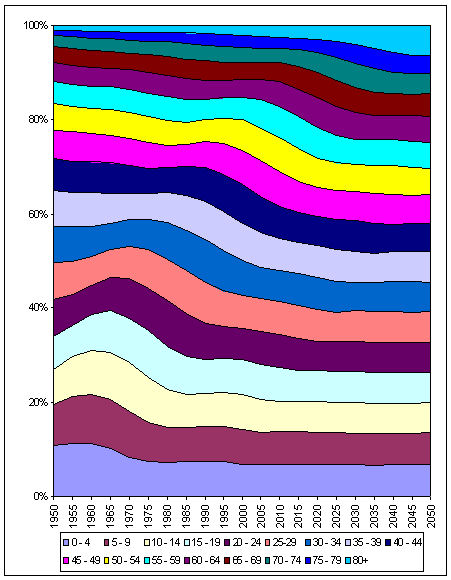
Mark Thoma at Economist’s View posted the following graphical representation of changes in the age distribution of the population of the U.S. between 1950 and today, and projected to 2050:

agedist_9_19_05

The bump, slowly moving off to the right, is the baby boom generation. The downward slope in the lines as you move to the right represents a population with a larger percentage of older people or, in other words, an older average age. If the forecast is correct, about 10 percent of the U.S. population will be over 75 by 2050.

Mark observes that many examinations of historical trends likely need to take into account this changing age distribution. For example, he asks:

…with a larger and larger fraction of the population moving into the asset liquidation phase of their life-cycle, how is the saving rate affected? How much of the change in the saving rate in recent years is attributable solely to changes in the age-distribution of the population?

—————————

Lisa Wade is a professor of sociology at Occidental College. You can follow her on Twitter and Facebook.

This ad for Ripolin paint reads:  “You walls deserve a paint wich [sic.] will age well.”

Not safe for work:

more...

Jeffrey T. found this page on Amazon suggesting gifts for different people in your life. He thought it nicely illustrated not only “…gender roles in our society, but also of age roles and, perhaps, class roles as well.”

Here’s the page (below are close up screenshots and quick, snarky comments):

capturebb

What is a woman’s lifecycle like?

Girlfriends and wives are apparently obsessed with fashion.  They want nothing else:

wife

By the time you’re a mom, your interest in fashion is accompanied by escapism and the need for a freakin’ break (jewelry would be nice though):

mom1

Grandmas love flowers and they fill their days doing crafts, scrapbooking, and listening to showtunes:

gma

Is it different for men?

After work, husbands/boyfriends take off their dress shirt so they can rock out and play games:

husband

Dads are still into “action and adventure,” but they need a break too and, also, they suddenly feel a pressing need to know more about waging war:

dad

By the time you’re a Grandpa, you just want to find a nice room away from Grandma’s show tunes to listen to classic music, watch documentaries (about war?), and read Time magazine with a safe, clean shave:

gpa

People who “have everything” (I think that means rich people), just need totally random unnecessary stuff (except for cocktail accessories, those are obviously a necessity):

evth

—————————

Lisa Wade is a professor of sociology at Occidental College. You can follow her on Twitter and Facebook.
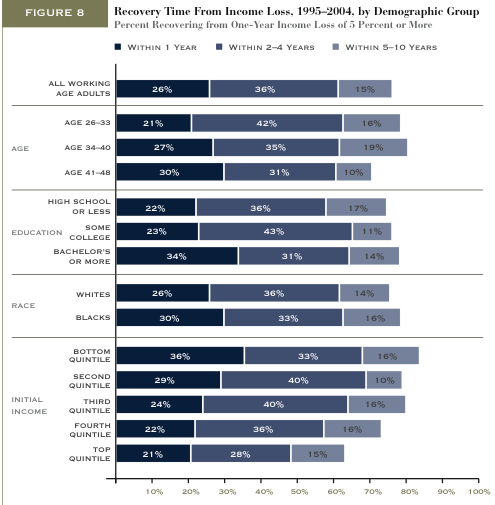
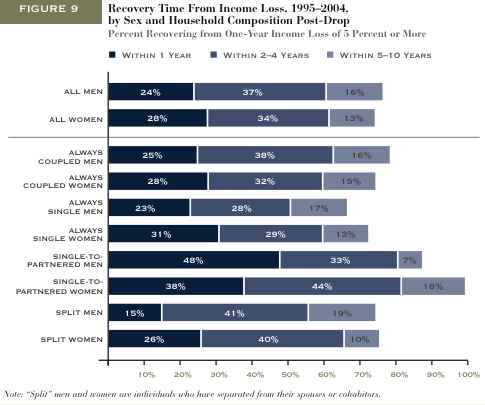
Matthew Yglesias featured two figures from the Pew Economic Mobility project.  They show how long different types of people tend to take to recover from income loss (within 1 year, 2-4 years, or 5-10 years).

This figure shows that people who are older, have more education, or are poor, working, or middle class have a harder time recovering from tough economic times:

recovery

This figure shows how marital status is related to recovery.  Most dramatically, people who get married before recovering financially (especially men), women who split with a partner, and women who are single have a more difficult time recovering.

recoverygender

Something to consider: As several commenters noted, I’m not sure how they defined “recovery” from income loss.  If you never made a lot of money to begin with, does recovery simply mean returning to a state of low income?  Then, does the income for an initially high income person need to return to its high state for it be counted as a “recovery”?

(Just FYI: I revised my interpretation of these figures.  Thanks to the early commenters who noticed I’d misinterpreted.  It was really late at night when I wrote this post!)

—————————

Lisa Wade is a professor of sociology at Occidental College. You can follow her on Twitter and Facebook.
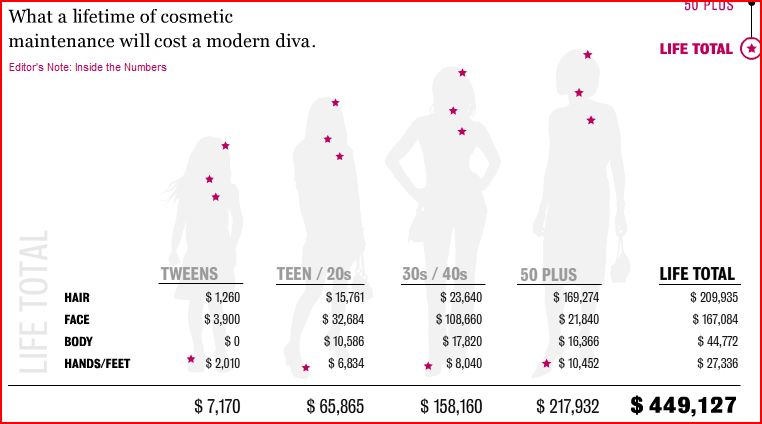
An  interactive graphic at Newsweek allows us to explore the amount of money women spend on beauty by their tweens, teens, 30s/40s, 50s, and, then, over the course of their lifetimes.  Below is a screenshots of the summary, click here to visit the graphic, and visit here for details on the numbers.

tween3