Search results for The

Way back in 1703, French settlers in Mobile, Alabama – at the time, the capital of French Louisiana and not much more than a tiny settlement attached to Fort Louis de la Mobile – decided to celebrate Shrove Tuesday with a feast and a party. Over the next few years, the celebrations grew more elaborate, with the first known parade taking place in 1711: the Boeuf Gras (“fatted ox”) society put together a large papier mache cow’s head and rolled it through town on a cart, which I’m sure made a lot of sense at the time.

(It is at this point that native Mobilians, like myself, like to point out that New Orleans wasn’t even founded until 1718, and that New Orleans’ oldest continually-parading organization, the Mistick Krewe of Comus, was founded by six guys from Mobile. Ahem.)

And so today we celebrate Fat Tuesday – the last hurrah before Lent – by dressing up in funny clothes, drinking to excess, dancing in the streets, and hurling moonpies at each other. To celebrate, I thought I’d share an interesting symbol and recommend an excellent documentary film on Mobile Mardi Gras, director Margaret Brown’s The Order of Myths.

oom

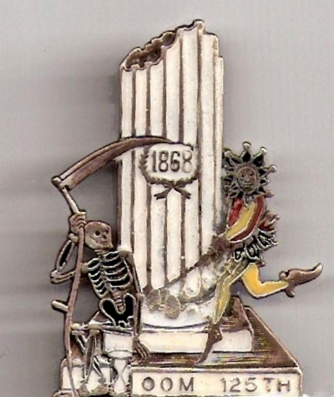
What we have here is Folly chasing Death around a broken Ionic column, while whacking Death with gilded pig bladders; seeing as how during Mardi Gras the normal social order is overturned, why not the natural order as well? Here’s a similar image from a float:

2318194724_3ac36be568

To me, these images sum up a lot of what’s great about Mardi Gras: it’s a finger in the eye of mortality and a celebration of a kind of genial lunacy. But what about that Ionic column? Well, the decoding gets a little stickier there.

I’ve heard a couple of different explanations: one is that the column represents time, the other that it represents the Confederacy or the Old South more generally. It gets a little more complicated when you look at it in context: this particular image is the emblem float of the Order of Myths, and is pulled by donkeys mules and lit by gaslight lamps – which are carried by young African-American men – in the same manner it has been since the founding of the organization shortly after the Civil War. Mobile’s mystic societies, you see, remain firmly segregated, which brings me to Margaret Brown’s excellent film.

Brown – whose first full-length documentary, Be Here To Love Me, is an excellent if crushingly depressing film about Texas songwriter Townes Van Zandt – is a fellow Mobile expat, and her film examines the complexities of race, class, and collective memory in Mobile as embodied in the 2007 Mardi Gras season. She focuses primarily on the two parallel Mardi Gras courts and documents some tentative steps toward integrating the two. I won’t say much more, for fear of spoiling the film for you, except to remark that the past is very much present in the film, in ways that both William Faulkner and Pierre Bourdieu would appreciate. And I’d also add that Brown eschews a heavy-handed or didactic approach in favor of laying the situation out for the viewer and letting them draw their own conclusions, with a few subtle editorial decisions and one late-in-the-game revelation that throws much of the previous hour and a half into a new and intriguing light. Here’s a trailer for the film:

My only real criticism of The Order of Myths is that Brown focuses primarily on the Mardi Gras elite – a little of Joe Cain Day (held the Sunday before Fat Tuesday and known as “the People’s Parade” because pretty much anybody can be in it if they can get a slot) would have gone a long way: class in Mobile is not quite coterminous with race, after all. There’s a lot more to Mobile Mardi Gras than the royal courts, and we don’t really get to see much of that. Similarly, the school featured in the film is more integrated than you’d think, as are the crowds along the parade routes, given what’s shown in the film.

But these are relatively minor points – by and large, Brown tackles the subject with a keen and incisive eye, and I’d highly recommend it to anyone teaching a class on race in the United States.

———————-

For the record, the title of the post translates as “time flies, remember you are mortal, party on.”

Cynthia Enloe draws attention to how mobilizing a nation at war requires drawing on not just the notion of the heroic masculine protector, but also the vulnerable women and children who must be protected.  To draw attention to the way in which this binary (protector/protected) has functioned, she wrote “women and children” as “womenandchildren.”   Speaking very generally, women and children, and perhaps especially womeandchildren, are sympathetic characters in society in a way that men simply are not.  Likewise, women and children often seem more deserving of assistance and charity than men, who are expected to buck up and take care of themselves.

Stephen W. found himself confronted with this solicitation when making an internet purchase:

women27s20heart20disease1

Stephen wondered why he would want to “wipe out heart disease in women,” as opposed to “wipe out heart disease”? 

Why indeed?

Perhaps the appeal to save a group we often understand to be vulnerable and deserving of assistance makes (or is believed to make) this a more effective solicitation.

NEW (Jan ’10)!  Anna K.-B. sent in another instance of this women-need-extra-care-and-protection thing.  In this case, it’s a walk to end women’s cancers only:

top

The Active Life Movement has produced these ads as part of their campaign against childhood obesity:

activelifesuperhero

activelifebarbie

 activelifepirates

What irks me about this ad campaign is the negative message (i.e., the implicit “don’t”).  The message is: Don’t look like this.  And, maybe secondarily: Don’t eat a lot, watch TV, use your computer, or have conversations (?).   It’s ultimately restrictive and shaming.

The message could be a positive one (i.e., an implicit “do”): Do go outside, play, learn to dance, enjoy nature!  All of those would (presumably) accomplish the goals of the Active Life Movement without shaming people who don’t look like Barbie, Superman, or Legos (?) and who like to eat food, watch TV, be on the computer, and sit down sometimes.

Ultimately, then, instead of promoting the behaviors the organization likes, the advertisers resorted to reinforcing fat phobia/hatred and the stereotype that fat people just sit around and eat.

[I just realized I’m sitting in my bed, with a cat, having tossed off my shoes, I’m on my computer… and I am eating a SNACK!!!! Oh no!!!!!]

(Ad Freak via Shapely Prose.)

As former a sexual health educator and current sexuality studies professor, I meet students whose ideas about sexually transmitted diseases (STDs) have been shaped by the ‘scary slideshow’: that series of full-color, close-up shots of the worst infections.

(Not safe for work–explicit images of STDs)

more...

Daniel T. Lichter and Domenico Parisi provide a couple of interesting images using 2000 Census data in a recent article about rural poverty. They use Census block-group data (block-groups are significantly smaller than counties) to identify non-metro areas of concentrated poverty. This map shows all block-groups with more than 20% poverty in 2000:

picture-17

If you overlaid this map onto a map of American Indian reservations, you’d notice that many of these high-poverty block-groups are on reservations–particularly in the Dakotas, Idaho, Montana, Arizona, and New Mexico.

UPDATE: Here’s a map of state and federal reservations put out by Pearson (you can find very detailed maps of individual reservations at the Census Bureau):

indian91

And TOTALLY AWESOME reader Matt Wirth overlaid the poverty map on the reservations map. The two maps weren’t exactly the same so some of the state outlines don’t line up perfectly, but you can get a good sense of how high-poverty block-groups (blue areas) and reservations (red areas) overlap:

poverty-over-20-and-indian-reservations

Clearly there are many poor block-groups in the west that aren’t associated with reservations, but we see an awful lot of overlap of blue on red, as well as in the regions directly surrounding reservations. Thanks so much, Matt!

We also see a band of high-poverty block-groups in border counties in Texas with high numbers of Latino residents, and of course the band along the Mississippi River and through the Black Belt up to North Carolina, and the ever-present Appalachian section.

Another note about the map: As Lichter and Parisi point out, if they had mapped poverty at the county level instead of the block-group level, many of these areas of high poverty would not have shown up. These are areas of concentrated poverty in counties that are not, overall, particularly poor. The authors note that studies of poverty that look at county-level data often miss isolated rural areas with extremely high poverty rates.

On a side note, see that little blotch of brown in north-central Oklahoma? That’s where I grew up! According to the 2000 Census, my specific hometown has a 17.6% individual poverty rate and the median home value is $24,400. That doesn’t matter to you, I know, but it does make me acutely aware of the problems of rural poverty.

The following bar graph shows how geographically concentrated poverty is among three racial groups. The graph shows what percent live in Census blocks of concentrated poverty–that is, areas where 20% or more of the population is poor (20% is the standard baseline among researchers for defining an area as “high poverty”):

picture-26

Clearly, in both metro and non-metro areas, a much higher percentage of all Blacks and Hispanics (both the poor and non-poor) than Whites live in areas of concentrated poverty. Notice (in the last two sets of bars) that less than 40% of poor Whites live in neighborhoods with such high proportions of poverty, whereas the vast majority of both Blacks and Hispanics who are poor live in areas where many of their neighbors are poor as well.

Lichter and Parisi argue that the concentration of poverty matters, particularly when it indicates that the poor are socially isolated. Such isolation can mean lack of access to social services, decent schools, and the types of social networks that provide job leads, recommendations, and so on. This type of social isolation can be much more harmful than being poor in and of itself, a topic also investigated by William Julius Wilson in When Work Disappears: The World of the New Urban Poor and The Truly Disadvantaged.

From “Concentrated Rural Poverty and the Geography of Exclusion,” Rural Realities, Fall 2008, p. 1-7, available from the Rural Sociological Society.

Wandering through the junior section of the Palo Alto mall after Christmas this year, my stepsister Holly noticed the suggestive nature of some of the brands.  We took pictures:

cimg2009

cimg2013

cimg2007

Much of the discourse around the benefits of being thin revolves around the assumption that extra pounds are harmful to health.  Ampersand at Alas A Blog posted about a study in the New England Journal of Medicine (citation below) that shows that  those who are overweight (according to the BMI scale) are not at a higher risk of premature death than those who are deemed of “normal” weight.   The boxes in red are categories in which the risk for premature death is equal to or less than the reference group (normal weight people).

rr_by_bmi_large

This is Ampersand’s conclusion (and his table, too).

The authors of the study, as commenter A.C. pointed out,  come to the opposite conclusion.  They argue, after looking at the data in different ways, say that overweight persons are at a higher risk for death.

Ampersand doesn’t buy it.  He offers a critique here where, among other things, he points out:

In order to produce the finding that “overweight” is less healthy than “normal weight,” Dr. Adams did a very dishonest statistical manipulation – he compared just one “normal” BMI range, representing the heaviest people in the “normal” range, to the entire “overweight” range. This is because the majority of people in the “normal weight” categories had a greater risk of death than the majority of people in the “overweight” category.

This might be a great way to discuss how methods and statistics never speak for themselves.

Relatedly, this post offers a really great visual critique of the BMI scale.

Citation:  Adams, K., et al., “Overweight, Obesity, and Mortality in a Large Prospective Cohort of Persons 50 to 71 Years Old.” New England Journal of Medicine, 2006. 355(8): p. 763-8.  Here if you have a subscription to ProQuest.

“Polls have always shown that the vast majority of Americans believe religion is “an important part of their daily lives” — 65% in a recent Gallup poll versus just 34% who said it wasn’t.

But that national average obscures a stunning variety by region.”

via The Wall Street Journal.

More precise data can be found at Gallup. In the comments, Jay pointed out work by John Sides at The Monkey Cage, that re-maps the data using absolute levels and accounts for a full range of responses, showing that “even in the least religious states, there’s plenty of that old-time religion.”religGiven that the dot-plot and map use the same data, it could make for an interesting debate on how to present data and the implications of differing analytic categories.