Search results for The

Who’s afraid of a global pandemic? We all are, at the
moment. But like so many other forms of fear, concern about medical issues is
much more acute for people in precarious and vulnerable social positions. The
privileged—particularly those who are white and upper class—can more afford not
to be preoccupied with health and medical concerns, including pandemics.

In our new book Fear Itself, we found consistent support for updating our classic theories about vulnerability. Classic theories often understand vulnerability in physical terms. But risk and vulnerability are also social, rather than primarily physical, and we found consistent evidence that members of disadvantaged status groups—particularly women, racial and ethnic minorities, and those with lower levels of social class—had higher levels of fear across many domains.

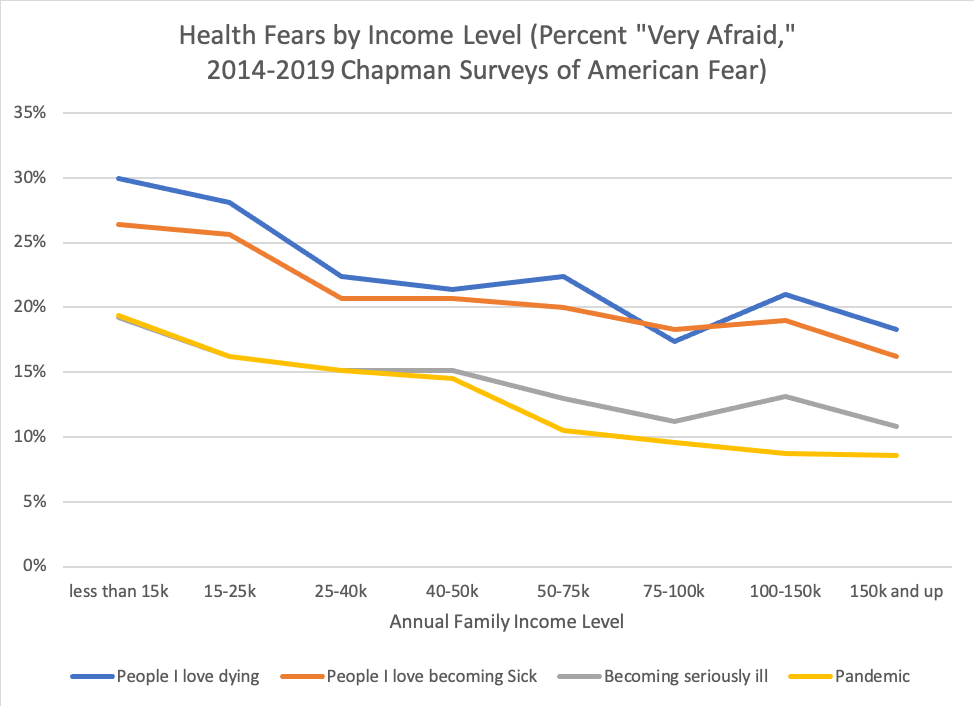
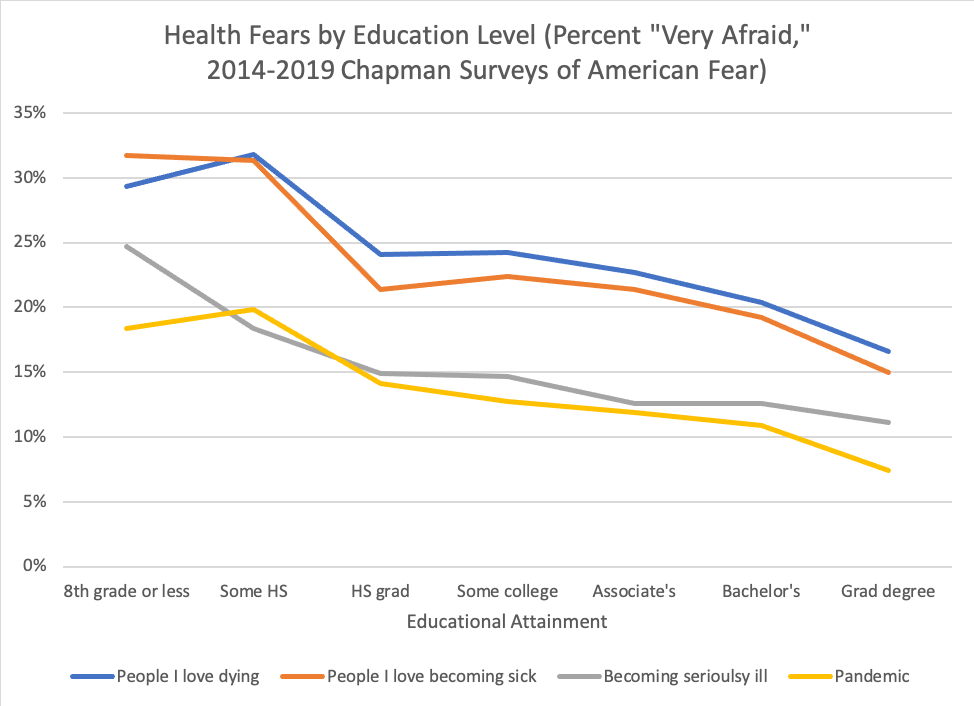
Using pooled data from six waves (2014–2019) of Chapman Survey of American Fears (CSAF), we examined the sociological patterns of fears about disease and health. We looked at fear about four specific issues: global pandemics, fears of becoming seriously ill, and fears about people you love becoming seriously ill or dying.     

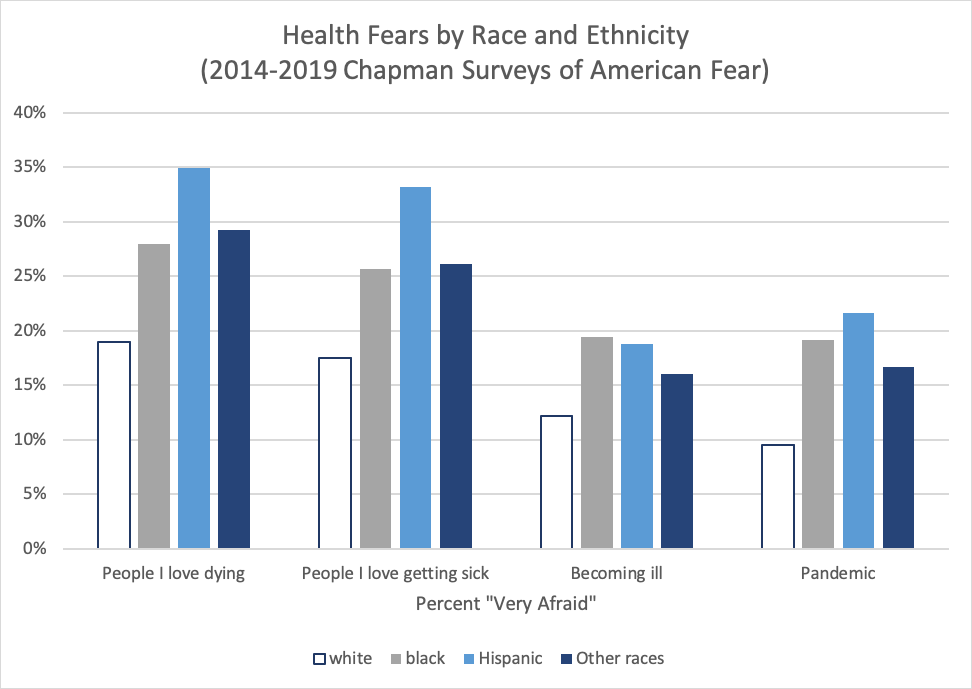
The racial and ethnic disparities across these four outcomes
are striking, with white Americans being significantly less likely to report
being “very afraid” of pandemics and medical issues involving themselves or
their families. Hispanic Americans reported the greatest concern about all four
issues, likely a reflection of lower rates of health care insurance and access
among Latino/a communities and individuals.

Likewise, we find clear disparities in fears about health and pandemics across different levels of education and family income. Again, the mechanisms are clear, with vast disparities in health care access in the United States, as well as the well-known social determinants of disease both playing a role.

While these patterns are not necessarily surprising, they are nonetheless disconcerting, for a number of reasons. First, in terms of the epidemiology of the Coronavirus pandemic, it is the disempowered who will disproportionately bear the brunt of the negative health effects, and who will be least equipped with the resources to adequately respond if and when they get sick. Second, when preventative public health measures such as quarantines are put in place, it is people in the working and lower classes who can least afford to take time off of work or keep their children home from school in order to comply with public health procedures.

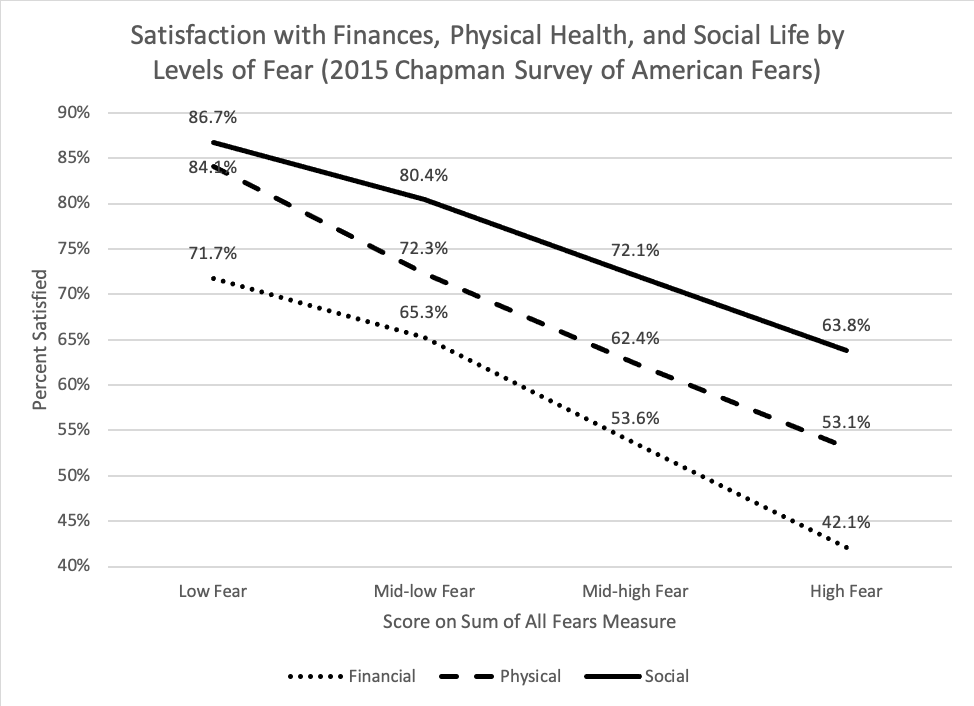
Not only does fear disproportionately prey upon people in less powerful social positions, it also exacerbates and deepens inequality. Higher levels of fear and anxiety are strongly and significantly related to harmful health outcomes, even after accounting for the social inequalities that structure who is afraid in the first place. In Fear Itself we created an omnibus fear metric we called the “Sum of All Fears” that combined levels of fear across a wide range of domains, including but not limited to health, crime, environmental degradation, and natural disasters. Scores on this global, summary fear metric once again produced strong support for social vulnerability theory; but levels of fear were also strongly connected to steep declines in quality of life across a range of domains, including social, personal, and financial well-being.

Taken together, fear is both a reflection of and a source of social inequality. This is true for the current global Coronavirus pandemic and the accompanying concerns, but it will also be the case long after the pandemic has passed. Our hope is that sociologists, social psychologists, and public health officials begin to consider how fear factors into and deepens social inequality.

Joseph O. Baker is Associate Professor in the Department of Sociology and Anthropology at East Tennessee State University and a senior research associate for the Association of Religion Data Archives.

Ann Gordon is Associate Professor of Political Science and Director of the Ludie and David C. Henley Social Science Research Laboratory, Chapman University.

L. Edward Day is Associate Professor and Chair of the Sociology Department at Chapman University.

Christopher D. Bader is Professor of Sociology at Chapman University and affiliated with the Institute for Religion, Economics and Culture (IRES). He is Associate Director of the Association of Religion Data Archives (www.theARDA.com) and principal investigator on the Chapman University Survey of American Fears.

Sociologists spend a lot of time thinking about lives in social context: how the relationships and communities we live in shape the way we understand ourselves and move through the world. It can be tricky to start thinking about this, but one easy way to do it is to start collecting social facts. Start by asking, what’s weird about where you’re from?

I grew up on the western side of the Lower Peninsula of Michigan, so my eye naturally drifts to the Great Lakes every time I look at a map of the US. Lately I’ve been picking up on some interesting things I never knew about my old home state. First off, I didn’t realize that, relative to the rest of the country, this region is a hotspot for air pollution from Chicago and surrounding industrial areas.

Second, I was looking at ProPublica’s reporting of a new database of Catholic clergy credibly accused of abuse, and noticed that the two dioceses covering western MI haven’t yet disclosed information about possible accusations. I didn’t grow up Catholic, but as a sociologist who studies religion it is weird to think about the institutional factors that might be keeping this information under wraps.

Third, there’s the general impact of this region on the political and cultural history of the moment. West Michigan happens to be the place that brought you some heavy hitters like Amway (which plays a role in one of my favorite sociological podcasts of last year), the founder of Academi (formally known as Blackwater), and our current Secretary of Education. In terms of elite political and economic networks, few regions have been as influential in current Republican party politics.

I think about these facts and wonder how much they shaped my own story. Would I have learned to like exercise more if I could have actually caught my breath during the mile run in gym class? Did I get into studying politics and religion because it was baked into all the institutions around me, even the business ventures? It’s hard to say for sure.

What’s weird about where YOU’RE from? Doing this exercise is great for two reasons. First, it helps to get students thinking in terms of the sociological imagination — connecting bigger social and historical factors to their individual experiences. Second, it also helps to highlight an important social research methods point about the ecological fallacy by getting us to think about all the ways that history and social context don’t necessarily force us to turn out a certain way. As more data become public and maps get easier to make, it is important to remember that population correlates with everything!

Evan Stewart is an assistant professor of sociology at University of Massachusetts Boston. You can follow his work at his website, or on BlueSky.

It’s Valentine’s Day, and my social media feed is more snarky than smarmy. The Hallmark holiday gets us thinking about love, but it also highlights our unquestioned assumptions about romantic relationships. The culture of love is tied up in all kinds of expectations: what we buy, how we date, even who does the dishes. A lot of sociological thought works to make these assumptions explicit, breaking them down to reveal the (sometimes sad) truth that many of us haven’t really thought that much about how we really want to love and be loved. 

But social science isn’t always depressing! Some recent work actually has pretty good news about the state of our romantic relationships. One example is Philip Cohen’s article published in Socius last year on “The Coming Divorce Decline.” Where many of us have gotten used to a story about rising divorce rates over the past few decades, Cohen finds that the probability of divorce for women has been declining from 2008 to 2017. Especially encouraging, he also finds that the probability of divorce for newly married women has been declining over same time period. 

Cohen, Philip N. 2019. “The Coming Divorce Decline.” Socius: Sociological Research for a Dynamic World 5:237802311987349.

In the article, Cohen writes:

…because the risk profile for newly married couples has shifted toward more protective characteristics, it appears certain that—barring unforeseen changes—divorce rates will further decline in the coming years.

And he even highlights how new data supported this prediction from an earlier draft of the paper!

Another example is a recent op-ed from Stephanie Coontz in The New York Times: “How to Make Your Marriage Gayer.” This piece is packed with current social science on relationships, from how couples split the housework to how they handle stress. One big takeaway from the research is better reported relationship outcomes for same-sex couples, and Coontz explains this in terms of our unquestioned assumptions about our love lives. Heterosexual couples tend to revert to more traditional assumptions about gender and relationship roles. But with fewer assumptions about gender and family roles at play, same-sex couples often have to (gasp!) openly talk about their needs, negotiate expectations, and generally do the things that make a relationship really strong.

So, if you’re grumpy this Valentine’s Day, remember that there’s some good news as well. As we learn more about what makes relationships work, we make it easier to navigate romance in a more open and honest way.

Hat tip to Erin McDonnell for tweeting this amazing SocValentine

Evan Stewart is an assistant professor of sociology at University of Massachusetts Boston. You can follow his work at his website, or on BlueSky.

I just wrapped up my political sociology class for the semester. We spent a lot of time talking about conflict and polarization, reading research on why people avoid politics, the spread of political outrage, and why exactly liberals drink lattes. When we become polarized, small choices in culture and consumption—even just a cup of coffee—can become signals for political identities. 

After the liberals and lattes piece, one of my students wrote a reflection memo and mentioned a previous instructor telling them which brand of coffee to drink if they wanted to support a certain political party. This caught my attention, because (at least in the student’s recollection) the instructor was completely wrong. This led to a great discussion about corporate political donations, especially how frequent contributions often go bipartisan.

But where does your money go when you buy your morning coffee? Thanks to open-access data on political contributions, we can look at the partisan lean of the top four largest coffee chains in the United States.

Starbucks’ swing to the left is notable here, as is the rightward spike in Dunkin’s donations in the 2014 midterms. While these patterns tend to follow the standard corporate image for each, it is important to remember that even chains that lean one way still mix their donations. In midterm years like 2012 and 2014, about 20% of Starbucks’ donations went to Republicans.

One side effect of political polarization is that corporate politics don’t always follow cultural codes. For another good recent example of this, see Chick-fil-A reconsidering its donation policies.

Evan Stewart is an assistant professor of sociology at University of Massachusetts Boston. You can follow his work at his website, or on BlueSky.

Sociologists
studying emotion have opened up the inner, private feelings of anger, fear,
shame, and love to reveal the far-reaching effects of social forces on our most
personal experiences. This subfield has given us new words to make sense of shared
experiences: emotional labor in our professional lives, collective
effervescence at sporting events and concerts, emotional capital as a resource
linked to gender, race, and class, and the relevance of power in shaping
positive and negative emotions.

Despite
these advances, scholars studying emotion still struggle to capture emotion
directly. In the lab, we can elicit certain emotions, but by removing context,
we remove much of what shapes real-life experiences. In surveys and interviews,
we can ask about emotions retrospectively, but rarely in the moment and in
situ.

One
way to try to capture emotions as they unfold in all of their messy glory is
through audio diaries (Theodosius 2008). Our team set out to use audio
diaries as a way to understand the emotions of hospital nurses—workers on the
front lines of healthcare. We asked nurses to make a minimum of one recording
after each of 6 consecutive shifts. Some made short 10-minute recordings. Some
talked for hours in the midst of beeping hospital machines and in break rooms,
while walking to their cars, driving home, and as they unplugged after a long
day. With the recorders out in the world, we couldn’t control what they
discussed. We couldn’t follow-up with probing questions or ask them to move to
a quieter location to minimize background noise.

But what this lack of control gave us was a trove of emotions and reflections, experienced and processed while recording. One fruitful way to try to distill these data, we found, was through visuals. We created wavelength visualizations in order to augment our interpretation of diary transcripts. Pairing the two reintroduces some of the ‘texture’ of spoken word often lost in the transcription process (Smart 2009:296). The following is from our new article in the journal, Qualitative Research (Cottingham and Erickson Forthcoming).

In this first segment, Tamara (all participant names are pseudonyms) describes a memorable situation in which a patient’s visitor assumed that Tamara was a lower-level nursing aid rather than a registered nurse (the full event is discussed in greater detail in Cottingham, Johnson, and Erickson 2018). This caused her to feel “ticked” (angry), which is the word she uses after a quick, high-pitched laugh that peaks the wavelength just after the 30-s mark (Figure 1). The wavelength peak just after the 1:15 mark is as she says the word ‘why’ with notable agitation in ‘I’m not sure why. Maybe cuz I’m Black. I don’t know.’

Figure 1. Tamara’s “Ticked” Segment (shift 2, part 1)

We can compare Figure 1 that visualizes Tamara’s feelings of
anger with the visualization of emotion in Figure 2. “Draining” is the
description Tamara gives at the beginning of this second segment. The peak just
after the 15-second mark is from a breathy laugh as she describes her sister “who
has MS is sitting on the bedside commode” when she gets home from work. After
the 45-second mark, she has a similar breathy laugh but in conjunction with the
word ‘compassionate’ as she says ‘I’m trying to be as empathetic and
compassionate as I want to be, but I know I’m really not. So I feel kinda
crappy, guilty maybe about that.’ Just before the 1:30 mark she draws out the
words ‘draining’ and ‘frustrating’ before finishing: ‘because you leave it and
you come home to it…you know…yeah.’ We can see that the segment ends with
longer pauses, muted remarks, and sighs, suggesting low energy and representing
the drained feelings she expresses, particularly in comparison to the lively
energy seen in the first segment when she discusses feeling angry.

Figure 2. Tamara’s “Draining” Segment (shift 2, part 2)

A second example comes from Leah, recorded while driving to work. Here she is angry (“pissed off”) because she has to work on a day that she was not originally scheduled to work. This segment is visualized in the waveform shown in Figure 3.

Figure 3. Leah’s ‘Righteous Indignation’ Segment (shift 2, part 1)
Figure 4. Leah’s ‘I Don’t Want to Stay’ Segment (shift 2, part 3)

In contrast to her discussion of being pissed off and working to ‘retain enough righteous indignation’ to confront her boss later (in figure 3), we see a different wavelength visualization in her second segment (figure 4). In that segment, she describes her lack of enthusiasm for continuing the shift. She reflects on this lack of desire (‘I don’t want to stay’) by stepping outside her own feelings and contrasting them with the dire circumstances of her young patient. This reflexivity leads her to conclude that she has reached the limits of her ability to be compassionate.

To
be sure, waveform visualizations are only meaningful in tandem with what our nurses say. And they do not
provide definitive proof of certain emotions over others. They can’t fully
identify the sighs, deep inhales, uses of sarcasm, or other subtle features of
spoken diary entries. They do, however, offer some insight into how speed,
pitch, and pauses correspond to different emotional expressions and, arguably,
levels of emotional energy (Collins 2004) that vary across time and interactions.

While
there is little that can serve as a substitute for hearing the recordings
directly, the need to protect participants’ confidentiality compels us to turn
to other means to convey the nuances of these verbalizations. Visualization of
wavelengths, in combination with transcripts, can lend themselves to further
qualitative interpretation of these subtleties, conveying the dynamics of a
segment to others who do not have direct access to the recordings themselves.

Check
out the full, open-access article on this topic here and more on the experiences of nurses
here.

Marci Cottingham is assistant professor of sociology at the University of Amsterdam. She researches emotion and inequality broadly and their connection to healthcare and biomedical risk. She is a 2019-2020 visiting fellow at the HWK Institute for Advanced Study. More on her research can be found here: www.uva.nl/profile/m.d.cottingham

References:

Collins, Randall.
2004. Interaction Ritual Chains. Princeton, New Jersey: Princeton
University Press.

Cottingham,
Marci D. and Rebecca J. Erickson. Forthcoming. “Capturing Emotion with Audio
Diaries.” Qualitative Research. https://doi.org/10.1177/1468794119885037

Cottingham,
Marci D., Austin H. Johnson, and Rebecca J. Erickson. 2018. “‘I Can Never Be
Too Comfortable’: Race, Gender, and Emotion at the Hospital Bedside.” Qualitative
Health Research
28(1):145–158. https://doi.org/10.1177/1049732317737980

Smart,
Carol. 2009. “Shifting Horizons: Reflections on Qualitative Methods.” Feminist
Theory
10(3):295–308.

Theodosius,
Catherine. 2008. Emotional Labour in Health Care: The Unmanaged Heart of
Nursing
. NY: Routledge.
[

Modern policing is often characterized by quasi-militaristic tendencies, from “wars” on drugs and crime to its use armored vehicles and automatic weapons. The Department of Defense 1033 Program, which provides military equipment slated for storage to law enforcement agencies, is a popular way that police and sheriff’s departments acquire military gear. According to data from the Defense Logistics Agency, acquisitions of military equipment by state and local law enforcement sharply rose to a peak in 2016, and then have declined in recent years. But what explains participation in the DOD’s program? Which police departments acquire the most military equipment?

In a recent study published in Criminology, David Ramey and Trent Steidley investigate whether law enforcement agencies participated in the program and how much gear they acquired using 1033 program participation and U.S. Census and American Community Survey data. They find that participation in the 1033 — but not the value of gear acquired — is greater in areas of higher violent arrests. They also find that, after controlling for crime rates and other factors, higher local Black and Hispanic populations correlate with higher levels of participation and greater value acquired.

Las Vegas Metropolitan Police SWAT
Las Vegas Metropolitan Police SWAT, Photo by Tomás Del Coro, Flickr CC

However, these racial patterns are not linear. Agencies operating in areas with very small and very large minority populations have low probabilities of program participation, but agencies that serve a more diverse community are most likely to obtain military equipment through the 1033 program. For those that do participate, increases in minority populations correlated with higher dollar values of equipment acquired, with each subsequent increase garnering even more gear than the last (an exponential increase). In other words, program participation increases in response to racial demographics up to an extent, but once an agency decides to participate, the value of military equipment requested dramatically increases as minority populations increase.

Trends in police militarization highlight two patterns. Law enforcement agencies respond to increasing crime rates with police militarization, possibly in an attempt to deter further crime. In contrast, the racial effects found in this study follow  a “minority threat” model, as military acquisitions correspond to the presence of racial minority groups. This research illustrates how race, net of the crime rates in an area, can pattern not only where police operate, but how they operate.

Ryan Larson is a graduate student from the Department of Sociology, University of Minnesota – Twin Cities. He studies crime, punishment, and quantitative methodology. He is a member of the Graduate Editorial Board of The Society Pages.

For feminists, liking Barbie is tough.  This top selling American toy has long been criticized for fueling sexist stereotypes, because women are not actually focused on dream houses, dream dates, beauty, and unbridled consumption. 

And yet Mattel has made attempts to refashion the doll as women’s positions in society have changed.  By the 1990s Barbie had careers as a firefighter, police officer, and in the military.  She had also been a racecar driver, a pilot, and a presidential candidate.  However, the 90s also gave us the infamous Teen Talk Barbie whose voice box had been programmed to say, “Math class is tough.”

The Barbie Liberation Organization (B.L.O.) switched Teen Talk Barbie’s voice box with that of talking G.I. Joe, and put the altered dolls back into their original packages and back onto store shelves.  They released videotapes to major television news outlets explaining their action and calling attention to Mattel’s outdated gender ideology.  With G.I. Joe saying, “Let’s sing with the band tonight” or “Wanna go shopping?” and Barbie saying, “Dead men tell no tales” the B.L.O.’s media-savvy culture jam threw our gendered expectations into sharp relief.   

In addition to the B.L.O., women’s groups expressed concern that Barbie’s math-anxious statement would discourage girls from pursuing math and math-related fields, and so Mattel removed the offending remark from Barbie’s voice box.

Inspired by the B.L.O. and other culture jammers, for Barbie’s 50th anniversary in 2009 I initiated a “Barbies We Would Like to See” exhibition on my campus.  The exhibition included Muslim Girl Barbie (made from a 1960s Skipper doll), Stay-At-Home-Dad Ken, Public Breastfeeding Barbie, and Lesbian Wedding Barbie—to name a few.

Public Breastfeeding Barbie and Lesbian Wedding Barbie (Photos by Martha McCaughey)

And now, as Barbie turns 60, we can see how participatory social media has made it possible for anyone with a dream for Barbie to share it instantaneously and widely.  For example, Black Moses Barbie videos on YouTube use Barbie dolls to depict imagined moments in history with Harriet Tubman, and photographer Mariel Clayton creates elaborate scenes with Barbies—sometimes violent, sometimes sexual, sometimes both—which she photographs and shares on her public Facebook page.  There are entire Instagram accounts devoted to depictions of Barbie and social critiques made through Barbie, for instance Sociality Barbie, the anonymous Instagram feed with over 800,000 followers that depicts Barbie as a Portland, Oregon hipster.  In our documentary video on Barbie in the age of digital reproduction (produced by Martha McCaughey and Beth Davison, linked above), we see how these artists and Barbie hackers go much farther than Mattel to re-imagine gender and pop culture.  Indeed, they make curvy Barbie, released in 2016, and the gender-neutral Creative WorldTM dolls, released this year, look pretty conventional.

In line with Rentschler and Thrift’s (2015) argument that feminist meme propagators do feminist cultural production, Barbie artists and activists sharing their altered dolls on social media are doing feminist cultural production and creating “feminist community-building media” (Rentschler 2019).  In this age of digital reproduction Mattel can neither thwart nor ignore what people want to do with their dolls.  Indeed, the changes Mattel has been making to their dolls can be seen as a direct result of the willingness of artists, activists, and fans to playfully engage with—rather than simply criticize—their dolls. 

Barbie has always been malleable.  Thanks to feminist media, perhaps Mattel can now acknowledge what Barbie hackers have long known: that gender, like the doll itself, is plastic.  

Martha McCaughey is Professor of Sociology at Appalachian State.  She is the author of The Caveman Mystique: Pop-Darwinism and the Debates Over Sex, Violence, and Science, and Real Knockouts: The Physical Feminism of Women’s Self-Defense.She blogs on sexual assault prevention at See Jane Fight Back.

Works Cited

Rentschler, Carrie, 2019.  “Making Culture and Doing Feminism.” Pp. 127-147 in Routledge International
Handbook on Contemporary Feminism
Ed. by Tasha Oren and Andrea Press.

Rentschler,
Carrie and Samantha Thrift, 2015. “Doing Feminism in the Network: Networked
Laughter and the Binders Full of Women Meme” Feminist Theory 16:3:329–359.

Community-police advisory board bowing their heads in prayer

We bowed our heads in prayer to mourn yet another loss. It was the third murder in a week. The police captain called a meeting together to develop collaborative alternatives to enforcement so the mostly Black and Latino civilian volunteers could get more involved in promoting crime control. Lakeside, where I was conducting research, is in the heart of South LA’s “Black Belt”. The neighborhood is characterized by high rates of gang crime and violence, extreme poverty, widespread resentment toward police and is the site of the most destructive riots in US history. “We have to take our community back!” one meeting participant said as his voice cracked from the tears and frustration welling up inside him. Agreeing that something had to be done, the captain broke us into groups to spitball ideas. One popular idea was to canvass the affected neighborhood. Volunteers would pass out business cards and encourage residents to call with information about the shooting.

The cards that we handed out door-to-door were simple—bold lettering against a light background, the organization’s name and phone number, and a promise to protect anonymity—but they could also be socially impactful. Until then I was focused solely on power struggles in “community policing,” a post-riot policy that calls for greater civilian participation in law enforcement. Calling 9-1-1 is perhaps the clearest example of civilians “coproducing” social order. And canvassing with these cards only reinforced just how crucial civilian involvement is for law enforcement; their information and the lack thereof can directly shape case outcomes.

Then I started looking more closely at the cards and flyers that police and civilians passed around at community meetings. Visual rhetoricians look at textual and/or visual data and pick apart the “blocks of meaning” that authors arrange when composing documents such as flyers. Composition is a rhetorical act; its intention is to convince an audience. We can interpret these blocks on two registers, the presented and the suggested. The author presents a woman being robbed by an anonymous figure and frightened as a result. They explain how we, the audience, can change our daily routines to minimize our chances of being victimized and give us police contact information. Sociologist David Garland helps us see the suggested elements. He might point to this as an example of the new role of police as a key socializing institution, reflected here in the evocation of a specific outlook. Fear of crime today is at an all-time high; so high, in fact, that it far exceeds the realities of crime victimization in the US. This flyer gives us the sense, however, that crime is everywhere, every day, and that we ought to fulfill our civic responsibility to defend the community.

Drawing on over two years of ethnographic fieldwork and nearly two hundred documents, my new project, The Social Life of Flyers, seeks to understand what these artifacts do in community policing. Specifically, I seek to better understand the nature of flyers—their presented and suggested elements—and their bureaucratic functions beyond canvassing. My findings will reveal how police restrict rather than amplify civilian power in collaborative crime control. This work builds on my recently published coauthored book, The Limits of Community Policing, and can shape future ethnographic studies, research on police bureaucracy, and the craft of visual sociology.

Daniel Gascón is an assistant
professor of sociology at the University of Massachusetts Boston. For more on
his latest work, follow him on
Twitter.