Search results for survey

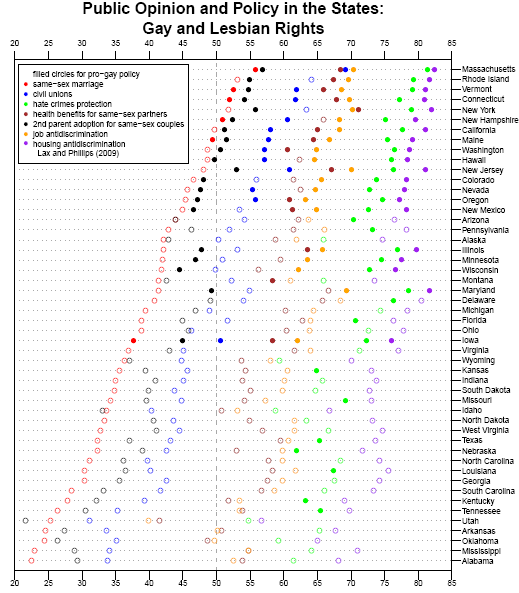
Andrew Gelman, over at FiveThirtyEight, presents a graph from data put together by Jeff Lax and Justin Phillips regarding opinions about various policies affecting gays and lesbians:
gay1

In another post, Nate Silver asks how public opinion about same-sex marriage might change if polls worded the question somewhat differently. Instead of asking “should the government allow same-sex couples to marry?”, we could just as well ask “should the government prevent same-sex couples from marrying?” He suggests that pro-gay-marriage groups might also frame the issue in this way–of keeping the government from taking away rights that people presumably already have rather than as the government giving new rights. It’s an interesting thought, and illustrates the role that question wording can play in affecting how survey respondents think about an issue.

UPDATE: Well, I was taken to task for not providing a better explanation of the graph. However, commenter Christopher explains it pretty well:

For each state, the status of seven public policies is listed as either pro- or anti-gay with seven colored circles which are either filled or empty with respect to the status. In addition, the position of the circle reflects the status of public opinion for each policy.

That is, each color represents one of the policies listed in the legend in the upper-left corner, so, for instance, red = public support for same-sex marriage. If the dot is filled in, it means gay-friendly legislation about the issue was actually passed in the state. If the dot is an empty circle, it means no gay-friendly legislation exists in the state. And the position of the circle tells you what percent of people in each state support each policy.

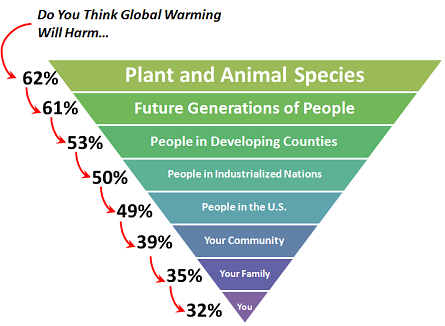
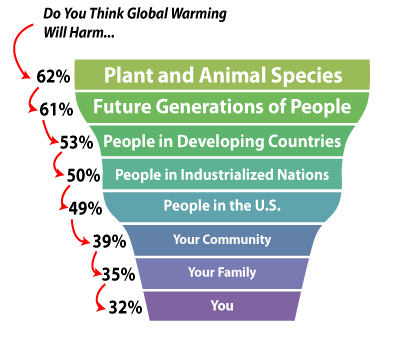
Nate Silver at FiveThirtyEight put up an image that illustrates the findings of a recent survey by George Mason University’s Center for Climate Change Communication.This inverted pyramid shows the percent of those polled who said they think global warming will hurt each group “a great deal” or “a moderate amount”:

warming

So as we see, the closer the question got to the person answering the survey, the less severe they thought the impacts of global warming were likely to be. Silver says,

These beliefs are not necessarily irrational. Climate change probably will have more impact on the developing world than the developed one, and it almost certainly will have more impact on our children than it does on ourselves.

But if individuals don’t perceive climate change to really have negative consequences for them or their families, they may not support climate change policies if they fear those policies will hurt jobs/business in the short-term, since they may be more likely to see the economic impacts as personally problematic.

UPDATE: An anonymous commenter pointed out that the 538 pyramid is a bit misleading. Brad Johnson at Wonk Room created a more representative one:

global_warming_perceptions

Thanks for the tip!

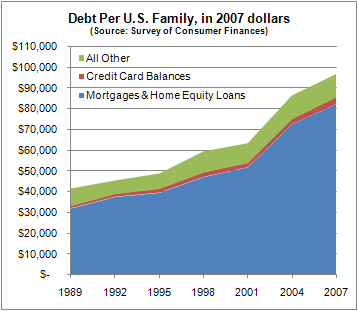
Nate Silver at FiveThirtyEight put up this graph of U.S. household debt (from the 2007 Survey of Consumer Finances):

debt2

Silver says,

Per-family household debt increased by about 130% in real dollars between 1989 and 2007, from roughly $42,000 per family in 1989 to $97,000 eighteen years later. Most of that increase has come during the past six or seven years — household debt increased by 52% between 2001 and 2007 alone. Almost all of the debt (about 85%) falls into the category that the Fed calls “secured by residential property” — which means mortgages and home-equity loans.

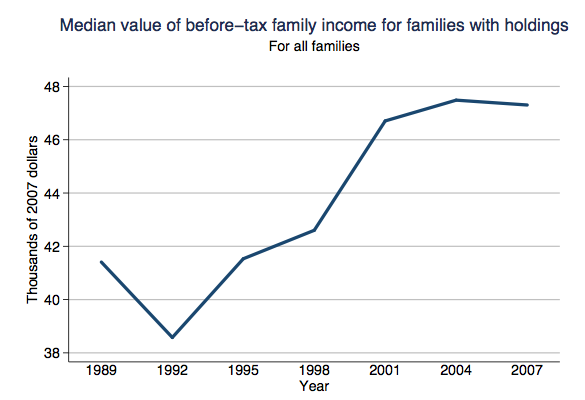
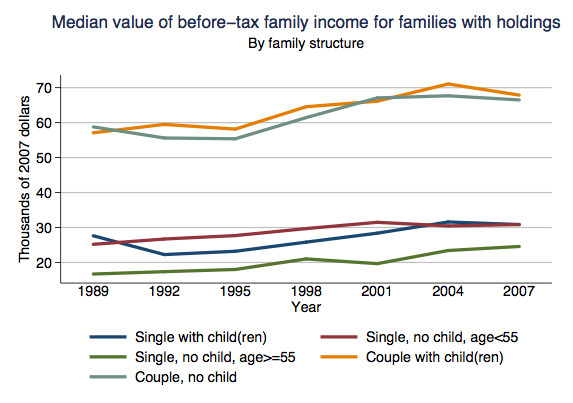
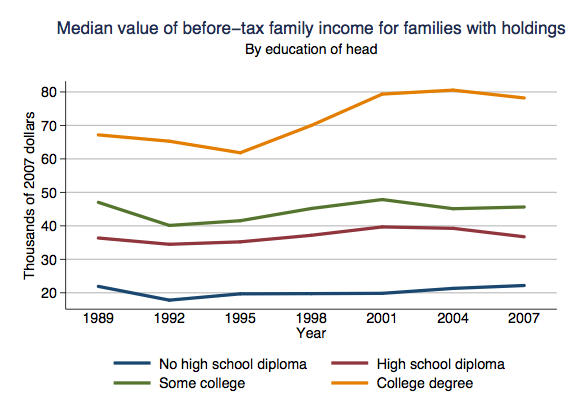
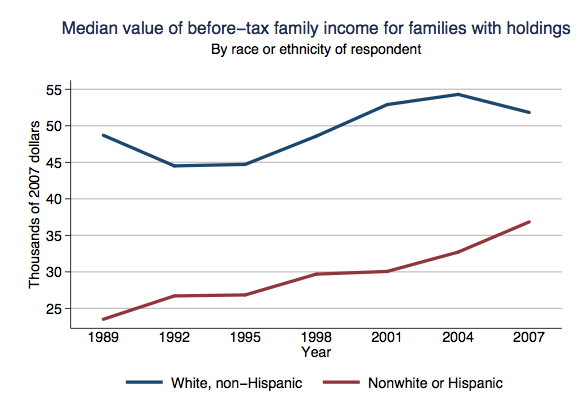
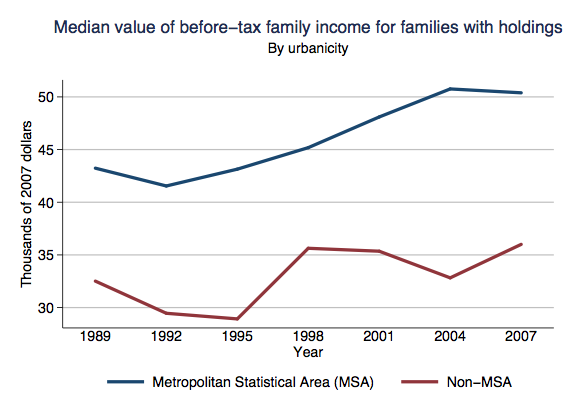
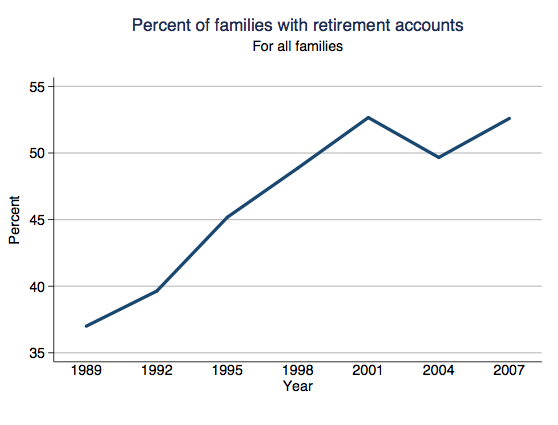
Some other images from the SCF Chartbook (available here)–and pay attention to the y axis, since the scale isn’t the same in all of them:

picture-16

picture-23

picture-3

picture-4

This next one is for rural (non-MSA) and urban (MSA) areas:

picture-5

picture-6

The Chartbook has images of the mean values for all these calculations as well, I just prefer the median to reduce the effects of outlier incomes.

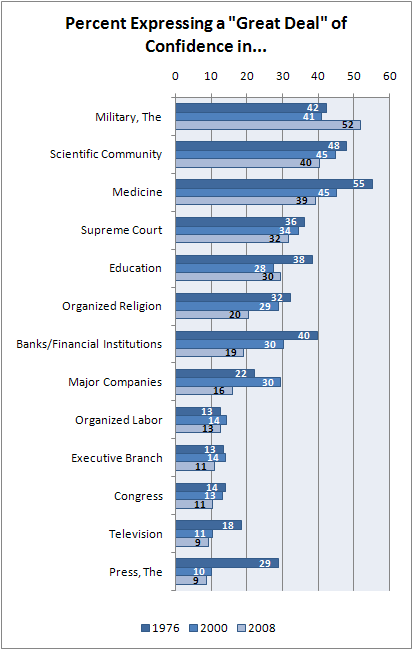
Nate Silver at FiveThirtyEight posted this graph showing Americans’ faith in various institutions (from the 2008 General Social Survey):

institutions

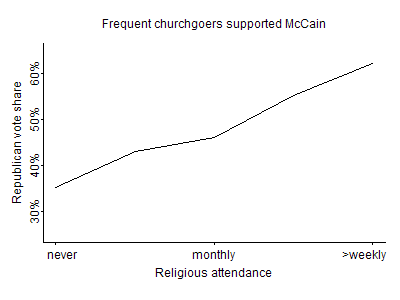
Andrew over at FiveThirtyEight posted about the association between religious attendance and voting behavior. Looking at the 2008 Presidential election, Pew data indicates that frequency of religious attendance is strongly related to likelihood of voting for McCain:

pewrelatt

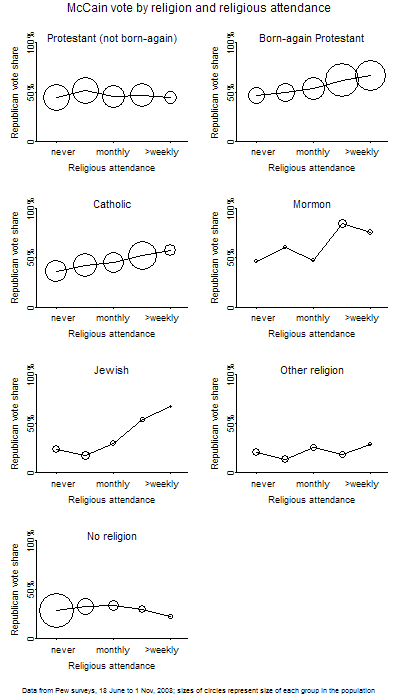
But looking more closely at the data, we can see that the relationship is more pronounced for some groups, such as born-again Protestants and Catholics, than others, such as non-born-again Protestants:

pewreligrelatt

From the original post over at FiveThirtyEight:

The size of each circle is proportional to the number of people represented in the survey. In particular, most of the people who attend church more than weekly are born-again Protestants.

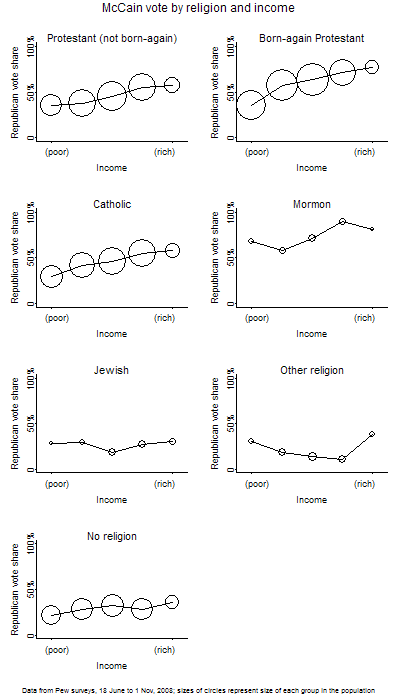
Another interesting thing to look at is the how income interacts with religion to influence voting patterns. These graphs show the McCain vote by income among various religious groups:

pewreliginc2

Notice that among Jews and the non-religious, increased income didn’t substantially increase the chances of voting for McCain (and those in the “other” category are just confusing). For these groups, being rich doesn’t appear to have been enough to draw them to McCain, whereas for most Christians we see a clear trend: the richer adherents were, the more likely they were to vote Republican. Both Jews and non-adherents started out much less likely to vote for the Republican ticket, and their opposition was strong enough that it trumped what we would expect to see if people voted on a narrow interpretation of self-interest (i.e., “I make $300,000 and Obama says he’ll raise income taxes on incomes above $250,000, so I’ll vote for the other guy”). Presumably Republican positions on social issues, or close association with evangelical Christians, put off some wealthy non-religious and Jewish voters who might otherwise be likely to vote for them based on fiscal policy, but that’s just a guess, since we don’t have data here on voters’ explanations of their candidate preferences.

Bri A. sent sent in photos of two ads found in complimentary magazines provided on a recent flight she took (she doesn’t remember the names of the magazines). Both have some interesting gender aspects.

The first is for Magnolia Hotels:

second1

Notice the suggested reasons women might be visiting the hotel: party, wedding, reunion, shopping, weekend, date, meeting, girl’s night, skiing (maybe? They’re light purple…). For men: big contract, date, presentation. Bri says,

The only professional woman presented to us in the ad is a woman who is going to a “meeting”. The woman’s shoes however, are a little racy for business and unlike her male colleagues, one of which is doing some sort of jig and the other which has forgotten his pants, she is giving us a little flirty heel raise rather than being humorous or professional. Another interesting difference that stuck out to me was the attire of the man and woman going on a date. The man going on a date is wearing a nice white suit, while the woman is wearing a much less formal and good deal more provocative outfit.

Actually, almost all the female feet are doing flirty little heel raises or half-kicks or something, which somehow doesn’t have quite the same effect as the kick the “big contract” guy is doing.

From another complimentary magazine Bri found on the same trip, an ad for Selective Search, a dating service for the business class:

first

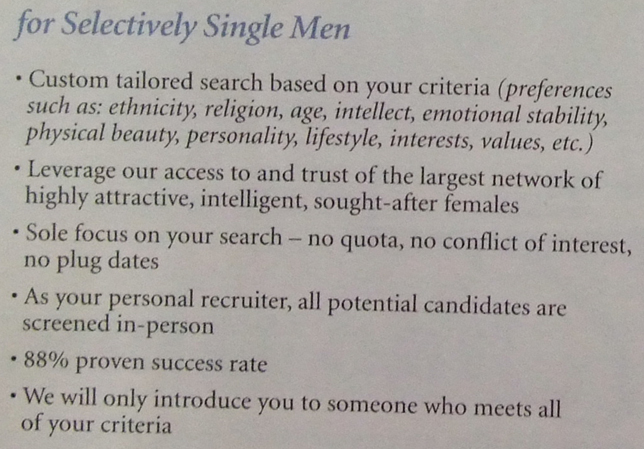
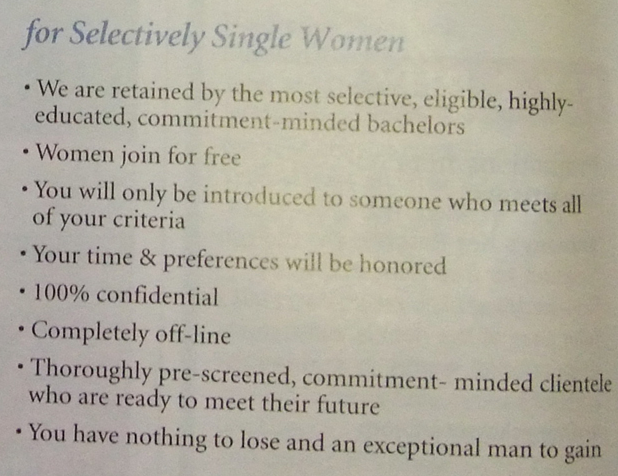
The company technically serves men and women. But notice that the image only depicts women, and in the second paragraph we learn that “we hand select the must-meet women for our clients.” Close-ups of the lists for “selectively single” men and women:

picture-14

picture-22

Notice the men are described as “clientele,” while the women are described as “candidates.” Here are two screenshots from the website, the first from the women’s section, the second from the men’s section:

picture-21

picture-13

So ladies, they’ll find you a guy who is commitment-minded, but there aren’t many other specifics–he’ll be a quality, eligible guy, but that could mean a lot of things. Guys get some more specifics–she’ll be attractive and desirable. Somehow a “guy who brings just as much to the table as you do” doesn’t sound quite the same to me as a woman “who meets your exacting standards and criteria.” Bringing as much to the table as you do implies equality. But having exacting standards that must be met doesn’t imply anything about equality–you can have standards for other people even though you couldn’t meet most of them yourself.

Aside from the specifics of the two images themselves, you might talk about the seeming assumption that though the dating service caters to both male and female customers, the people most likely to be reading an ad placed in a business magazine on an airline will be male, and thus the ad should target a male audience (by having images only of women and stressing meeting women in the text). The presumption is either that business people who fly aren’t women, or that women remember to bring their own reading material so they aren’t stuck reading the complimentary magazines the airlines provide.

Thanks, Bri!

UPDATE: In a comment, OP Minded says,

My brother has been in the dating service industry for about 10 years and he tells me that their internal research on this stuff is compelling and very very clear. In searching for a date on a dating service:

95% of women care most about 1) Educational level, and 2) Income.
95% of men  care most  about 1) Looks, and 2) Weight.

Other issues come in to play later in the process, but at the beginning, this is what most of the folks are looking for.

In another comment, Sandra points out,

…I do remember being taught in my undergrad speech department classes that, for instance, in studies on gender effects, when asked to fill out surveys on the street by either a male or a female, women are more likely to respond to the women poll-takers, but the men are also more likely to respond to the women poll-takers [than] men [poll-takers]. So perhaps the marketing move behind the photograph in this dating service ad was based on the idea that, women appeal to women, and women appeal to men. Hence, the women in the image.  It could be the women are intended to see themselves in the photos, as people using this service, and men are intended to see the women as possible dates. 

Good point, Sandra!

Francisco (from GenderKid) sent in a cartoon that questions the benefits of the One Laptop per Child program, which aims to give a simple version of a laptop with internet access to kids in less-developed nations, and also Alabama (available at World’s Fair):

From the OLPC program’s website:

Most of the more than one billion children in the emerging world don’t have access to adequate education. The XO laptop is our answer to this crisis—and after nearly two years, we know it’s working. Almost everywhere the XO goes, school attendance increases dramatically as the children begin to open their minds and explore their own potential. One by one, a new generation is emerging with the power to change the world.

There are a number of interesting elements you might bring up here, such whether introducing laptops is necessarily the best method to improve education wordwide, or who decided that this was an important need of children in these regions (my guess is the MIT team behind OLPC didn’t go to communities and do surveys asking what local citizens would most like to see for their educational system). I recently heard a story about OLPC on NPR, and while there seemed to be benefits in some Peruvian communities, in others the teachers spent so much time trying to figure out how to use the machines to teach subjects, without really feeling comfortable with them, that almost nothing was accomplished during the day. But once the laptops were introduced, they overtook the classroom; teachers were pressured by the Peruvian government to use the laptops in almost every lesson, even if it slowed them down or it wasn’t clear that students were benefiting from them. Another problem was that, though the laptops are built to be very strong and difficult to break, on occasion of course one will break. Families must pay to repair or replace them, which of course most can’t do, meaning kids with broken laptops had to sit and watch while other kids used theirs in class.

Benjamin Cohen uses the OLPC in an engineering class and brings up  concerns about…

technological determinism — [the idea] that a given technology will lead to the same outcome, no matter where it is introduced, how it is introduced, or when. The outcomes, on this impoverished view of the relationship between technology and society, are predetermined by the physical technology. (This view also assumes that what one means by “technology” is only the physical hunk of material sitting there, as opposed to including its constitutive organizational, values, and knowledge elements.) In the case of OLPC, the project assumes equal global cultural values & regional attributes. It also assumes common introduction, maintenance, educational (as in learning styles and habits), and image values everywhere in the world. Furthermore, it lives in a historical vacuum assuming that there is no history in the so-called “developing world” for shiny, fancy things from the West dropped in, The-Gods-Must-Be-Crazy style, from the sky.

How could the same laptop have the same meaning and value in, say, Nigeria and Indonesia, Papua New Guinea and Alabama, Malawi and Mongolia?

These critiques aren’t to say there is no value in OLPC, but that there are some clear questions about whether this is the most effective way to improve education in impoverished or isolated communities and what its consequences are. I doubt the OLPC creators meant for teachers to face government pressure to use the laptops for every lesson, no matter what, but that’s what has happened in at least some areas.

Another problem the NPR story highlighted was that the kids they reported about in Peru live in areas where there are absolutely no jobs available to capitalize on their tech skills, nor any reason to believe there will be any time soon. The government is pushing laptops in education, but without any economic development program to bring jobs to the regions to take advantage of these educated students. So the question is, after you get your laptop, you learn how to use it, you graduate…then what? Will the laptops spur more brain drain and out-migration? Is this necessarily good? Are countries like Peru using the laptop program as a quick, flashy substitute for the more boring, difficult, challenging process of economic development and job creation? As an educator, I’m thrilled with the idea of valuing learning and knowledge for its own sake, but on a more practical level, these questions seem like important ones.

Thanks, Francisco!

UPDATE: In a comment, Sid says,

…there’s kind of a vaguely imperialistic nostalgia in the first image of “Darkest Africa” as a simpler, more wholesome place where kids still play together in front of the hut and there’s a sense of community that you just don’t get in the modern world and blahdee blahdee blah.   The entire thing kind of smacks of a whitemansburden.org enterprise…

Gwen Sharp is an associate professor of sociology at Nevada State College. You can follow her on Twitter at @gwensharpnv.

This ad — found at the height of the foreclosure crisis in a magazine for the obscenely rich — points out that, for obscenely rich people, the crisis is a bonus.  What struck me most was the double meaning in the headline. “Above It All” has both descriptive and moral meaning. 

It is also a good example of how the rich see the economic struggle of the masses as an “opportunity” to get richer.

Text below.

Text:

Above It All.

Despite the headlines, high-end properties still in demand among affluent set.

What do recent headlines proclaiming a dip the [sic.] current real estate market mean for upper-income vacation-home buyers? Opportunity! A survey released in April by American Express and Harrison Group revealed that among Americans with a household income of more than $500,000, 77 percent say real estate presents a ‘real opportunity’ right now, and 40 percent say they’re in the market for property this year. Of those in the market, 33 percent are looking for a second home, and 25 percent are looking for a third.