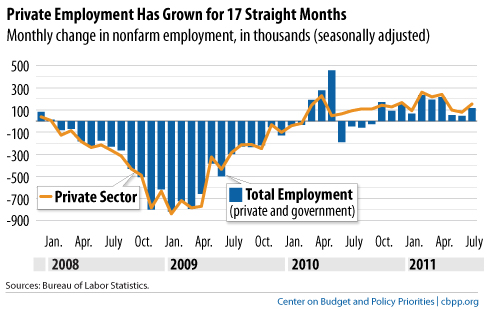
Laura E. sent in a link to the Off the Charts blog by the Center for Budget and Policy Priorities. They posted a set of charts highlighting ongoing unemployment in the U.S. Overall, the private sector has been adding jobs, but at generally very low levels:

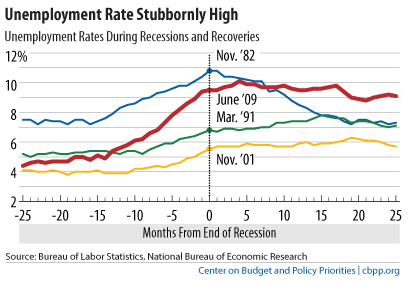
But we lost so many jobs relative to the overall working-age population during this recession that the slow job growth simply isn’t enough to significantly alter the unemployment rate, which is still hovering around 9% (though much higher for some groups, particularly young people and racial and ethnic minorities):

The increased labor force participation we saw during the 1990s and 200s have been erased:

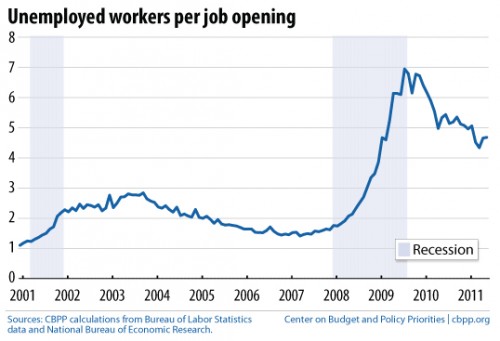
The CBPP has a collection of recession-related charts, including this graph of the number of individuals needing a job per each available job opening, a ratio that remains quite discouraging:

In the last few days since the debt ceiling fiasco, a number of economic experts have begun discussing the possibility of a double-dip recession and, as you may have heard, last night Standard & Poor’s downgraded the U.S. debt rating. Overall, it’s not an encouraging picture of our immediate economic future.

Dmitriy T.M. sent in a video put together by the Center for Investigative Reporting about some of the hidden costs of gasoline use in the U.S.:

Also check out our earlier posts on Lisa Margonelli’s TED talk about the political economy of oil in the U.S. as well as the inconsistent relationship between gas prices and how much we drive.

Cross-posted at Scientopia.

The U.S. Department of Commerce just released a report on the continuing gender gap in STEM jobs – that is, science, technology, engineering, and math. While women make up roughly half of the total paid workforce, they still held only a quarter of STEM jobs as of 2009:
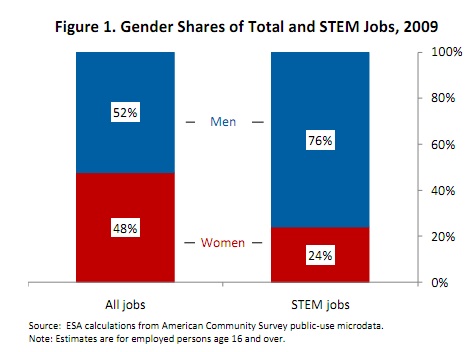
In fact, we saw no change in the gender make-up of STEM fields between 2000 and 2009.

There is significant variation in the gender composition within the STEM category, however. At the high end, women hold 40% of jobs in the physical and life sciences; the low point is engineering, where only 14% of employees are women. And the proportion of women in computer science and math jobs actually fell between 2000 and 2009, from 30% to 27% of workers.

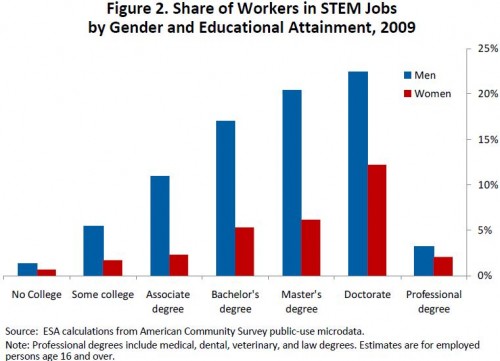
This isn’t simply because of differences in education, either. Here we see the proportion of both men and women in STEM jobs at various educational levels; while increased education correlates with a higher likelihood of having a STEM job for both groups, women are significantly less likely than men at every educational level to have a STEM job:
The gender disparity in STEM jobs is especially noteworthy because, on average, STEM occupations pay significantly more than other private-sector jobs, and the gender gap in pay is actually lower than in non-STEM sectors:
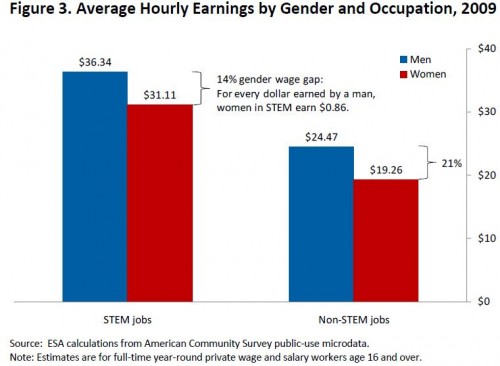
If we look only at women with bachelor’s degrees, women who earn STEM degrees and work in STEM jobs earn, on average, 29% more than other women.

So the underrepresentation of women in STEM jobs means that women are missing out on some of the best-paying occupations in the U.S.; in fact, this type of gender-segregation of jobs is one of the leading causes of gender gap in yearly and lifetime earnings.

The authors of the report don’t go into detail about potential causes of the gender gap in STEM careers, though they note that among those earning STEM degrees in college, women are significantly less likely than men to hold jobs in related STEM fields. They suggest this might be because STEM jobs are relatively unaccommodating to those who take time off for family obligations (disproportionately women), because of a lack of female role models in STEM fields (including as college professors), or because of gender stereotyping about math or science aptitude (like this, or this if you prefer a t-shirt) that pushes women away from STEM degrees and careers. [UPDATE: Broken links fixed!]

The complex interplay of factors that lead to a gender gap in who holds STEM-sector jobs provides significant challenges to increasing the proportion of women in these occupations — as indicated by the lack of change over the past decade. But particularly as we see increasing economic divergence between well-paid tech and information sector and low-paid service sector jobs, addressing the underrepresentation of women in STEM jobs will be essential as part of any effort to improve women’s lifetime earnings potential and overall economic outlook.

Yesterday I posted about some children’s luggage that normalizes gendered occupations. Given that, I thought I’d follow up with several more examples of gendering kids’ stuff that have been sitting in our inbox.

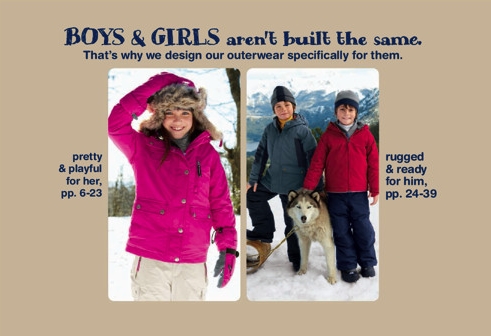
Erin M. saw this image in a Land’s End catalog for kids’ clothing a while back. It draws on the idea that boys and girls are just inherently different, with girls needing things that are “pretty” while boys need stuff that’s “rugged”:

Caspian P. snapped this photo of two video games (by different companies) that efficiently summarize who we assume will be interested in what:

Finally, Cheryl S. noticed that J. Crew decided to market some of their boys’ clothing to girls. Rather than designating the clothes as unisex, or listing them as boys’ items in the boys’ section and girls’ items in the girls’ section, they instead created a section in the girls’ part of the website called Borrowed from My Brother:

As Cheryl points out, there is no “borrowed from my sister” section for boys. We accept the idea of women wearing men’s clothing, even seeing it as potentially sexy, in a way that we don’t tolerate or condone men crossing gender lines to wear women’s items or take on other aspects of femininity. J. Crew simply applies this wider cultural acceptance of women taking on some aspects of masculinity (as long as they balance it with enough signs of femininity), which we see in the marketing of “boyfriend jeans” to women, and applies it to kids.

Emily H. sent in a great example of gendering kids’ products. She looked at kids’ luggage on the Target website and noticed a significant difference in the boys’ and girls’ version of one brand. The boys’ version, in the standard blue, is called “Embark Boy Pattern Pilot”:

The girls’ version is identical in size and construction. The girls’ versions are pink and purple, but that’s not the difference that drew Emily’s attention. Take a look:

Notice the name? Where the boys’ version is for pilots, the girls’ appears to be for the pilot’s assistant. Just a nice little example of the normalization of the idea that girls are supportive helpers to the boys who direct the show.

Jennifer F. sent in another example of the emphasis on female athletes’ looks. Here’s a recent screenshot from the Yahoo! Sports website:

So, ok, awesome, we have a featured story about Hope Solo, a member of the U.S. women’s soccer team. Except let’s take a closer look:

Yes, that’s right: the article emphasizes not her recent amazing performance in the World Cup, but rather how her skill and beauty make her marriageable. Sigh.

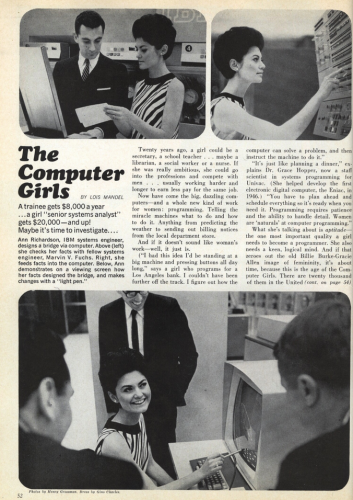
Today, the field of computer science is heavily male-dominated — men earn the vast majority of undergraduate and Ph.D. degrees in the field. But this wasn’t always true. When computers were first developed, we weren’t sure what kind of job programming was, whether a highly technical scientific occupation or a more secretarial-type one akin to being a typist. The fluidity of the developing field initially attracted significant numbers of women.

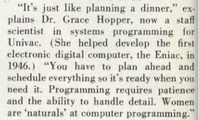
Anjan G. sent in an example of the normalization of computer programming as a female occupation, posted at Fog Creek. This article appeared in a 1967 issue of Cosmopolitan and quotes computer scientist Dr. Grace Hopper, a pioneer in the field, discussing why programming is a perfect fit for women — by drawing partly on gender stereotypes by assuming women are “naturals” at programming because they’re patient and pay attention to details:

You can find a larger image here.

Also, if you’re interested, Fog Creek, a software company, looked at their own data to see if male and female job applicants have equal chances of getting hired, and they posted an interview with the only woman working on their technical staff, an intern.

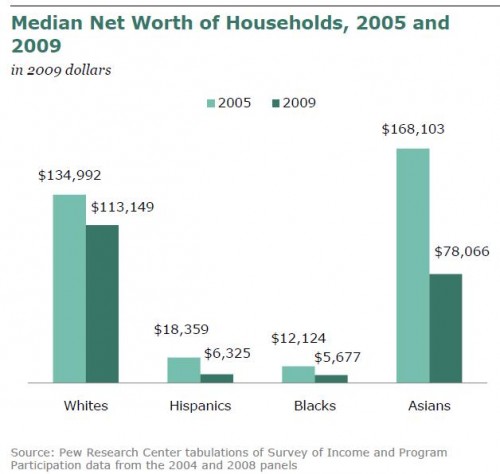
The Pew Research Center just released an analysis of 2009 government data on the wealth gap between White non-Hispanics, African Americans, and Hispanics, and it’s pretty depressing. It’s not just that the gap is so large, but also that Hispanic and African American households have such low median worth in absolute terms (p. 13 in the report):


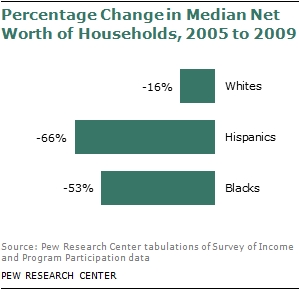
A quarter of Hispanics and Blacks have no assets other than a vehicle, compared to 6% of Whites. And 35% of Black and 31% of Hispanic households had negative median net worth in 2009, with their debts outweighing all of their assets; this was true of only 15% of White non-Hispanics.This is partially because African Americans and especially Hispanics were disproportionately hit by the effects of the housing crisis, the single largest source of reduced wealth. Overall, those two groups have suffered a much more dramatic loss in assets than Whites (sorry, Asians weren’t included in all the images, and Native Americans aren’t included in any):

The result is a wealth gap that is the largest it has ever been since the government began making such data available in the early ’80s. White non-Hispanics have nearly 20 times higher median wealth than Blacks, and 15 times as much as Hispanics:

For more details, check out the full report. The implications of these disparities, and the low levels of financial assets available to African Americans and Hispanics compared to Whites, is truly stunning.