work

Here we have another great vintage ad (1962) that upsets the idea that today’s norms are trans-historical.  First, the idea of having a “pint about midday” would be considered inappropriate by many U.S. employers (though, as several commenters have pointed out, not necessarily elsewhere).  Second, the large print — “Beer, It’s Lovely!” — sounds unmasculine today, even though these grizzled sea-farers likely would have seemed perfectly masculine enough at the time.

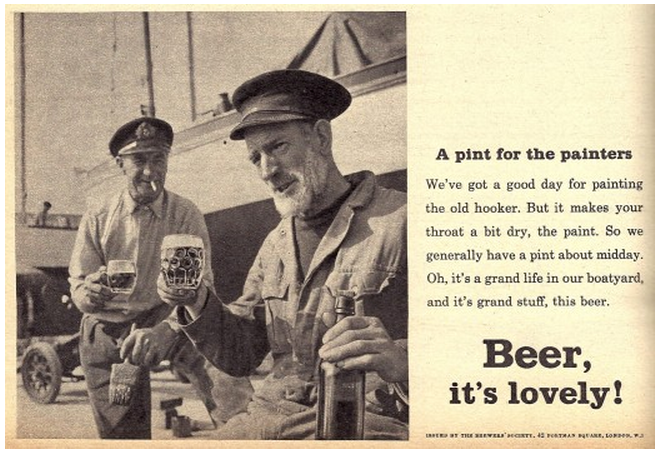
From the RAF Flying Review, found at Retronaut.

Lisa Wade, PhD is an Associate Professor at Tulane University. She is the author of American Hookup, a book about college sexual culture; a textbook about gender; and a forthcoming introductory text: Terrible Magnificent Sociology. You can follow her on Twitter and Instagram.

A while back I posted about a Pew study looking at long-term unemployment. About a third of those currently out of work have been unemployed for a year or longer.

That makes a recent video released by 60 Minutes Overtime particularly striking. The reporters discuss evidence of discrimination against the long-term unemployed, with employers particularly unwilling to hire those who have been out of a job for two years or more. Given the length and severity of the current recession, this leaves large numbers of jobless people facing the frustrating paradox that you often need a job to get a job, leaving them trapped:

Cross-posted at Reports from the Economic Front.

The Great Recession ended in June 2009, which means we have been in economic expansion for almost 3 years.  Lately the news has been filled with reports of positive economic trends, but how seriously should we take these reports?

One indicator worth looking at is median household income (the red line below).  Unfortunately its trend suggests little reason for cheer. In January 2012, median household income was $50,020.  That was 5.4% lower than it was in June 2009.  Even worse, as the chart below reveals, after a brief uptick it headed back down again.

untitled.jpg

It is true that employment is finally growing, a development reflected in the decline in the unemployment rate (the blue line above).  Unfortunately, this has done little to boost wages.  In fact, real wages actually fell in 2011.  The first chart below highlights the downward turn.  The second chart reveals just how far per capita earnings remain below historical trend.

us-real-wages_thumb.gif

real-wage-and-salary-disbursements-per-capita.jpg

This situation helps to explain why growth has been so anemic.  As the Wall Street Journal wrote:

Many economists in the past few weeks have again reduced their estimates of growth.  The economy by many estimates is on track to grow at an annual rate of less than 2% in the first three months of 2012.  The economy expanded just 1.7% last year.  And since the final months of 2009, when unemployment peaked, the economy has expanded at a pretty paltry 2.5% annual rate.

Without a dramatic change in median household income, growth will remain slow and even the limited employment gains we currently celebrate will likely prove impossible to sustain.  Given the current political climate, it is hard to see how this expansion will be either long lasting or bring meaningful improvements in majority living and working conditions.

Cross-posted at Organizations, Occupations and Work.

Last week the Wall Street Journal printed an article describing how CEOs around the world spend their time.  The article drew on data from a larger study, the Executive Time Use Project , and relied on reports of time use by CEO’s personal assistants.  The article indicates that assistants only tracked activities that lasted over 10 minutes in a single week selected by researchers.  That assistants, rather than the CEOs themselves, were keeping track of time use leads me to believe the reports are relatively accurate.  After all, the assistant probably does most of the scheduling of a CEOs day and CEOs are likely too busy to track data time or to agree to record their time use.

Here’s the break-down of the typical 55-hour work week for CEOs:

The hype about the findings is about the finding regarding time spent in meetings — 18 hours per week (see “Where’s the Boss? Trapped in a Meeting”).  I’m more interested in the task that occupies the greatest amount of a CEO’s time in a typical week—the 20 hours of “miscellaneous” activities.  The fine print indicates that the “miscellaneous” activities include time spent travelling, in personal activity including exercise or lunch with a spouse, or in short activities like quick, unscheduled phone calls.

The project website advertises that knowing how CEOs spend their time can tell a lot about management style and differences in cultures and performances.  Maybe it can, and here arearticles that tackle these issues.  I think it tells us something slightly different and far more basic than this: what constitutes “work” depends on who does it.  Would a study of low wage workers calculate as part of the work week “exercise”?  Do we count travel time to and from a job as “work” among mid-level managers?  The BLS American Time Use Surveys (Table 5, see footnote 2) do not include travel related to work in measures of work time. Why did the authors include as part of a CEO workday things like personal time and activities unrelated to work?

Without this personal time, a CEO’s average work week—35 hours—looks closer or shorter than other workers.   For example, among employed people who worked on an average weekday in 2010, the average weekly hours spent working at all jobs (excluding travel related to work), for workers with a H.S. diploma was 40.05 hours, for women who worked full-time, the average was 40.80 hours, for all full-time workers, the average weekly work hours was 41.95 hours (to calculate these weekly averages from the BLS, I assumed people worked 5 days a week which is typical for full-time workers, but may overestimate the work hours of those with a H.S. diploma).

Perhaps it is time to re-evaluate how we measure “work” or at least pay close attention to the ways we do so differently for workers at different levels of the hierarchy.  Now I’m headed to the gym for some exercise.  Should I all that “work”?  I’ll leave it to you to decide.

—————————

Julie Kmec is an associate professor of sociology at Washington State University.  She has conducted research on organizations and work, in particular on issues of gender and race inequality at work, the glass ceiling, employment discrimination, and sex segregation.  She is part of a working group at the Clayman Institute for Gender Research at Stanford University investigating ways to redefine work.

In a wonderful example of the social construction of time, there was no Friday, December 30th, 2011 in Samoa (NPR).

The country decided to move from one side of the International Dateline to the other.  The move, accomplished by skipping forward 24 hours, will allow it to align its week with its largest trading partners: Australia, New Zealand, China and Tonga.  Many business leaders were thrilled at the switch.

Thanks to sociologist Dan Hirschman for the tip!  Also in the social construction of time: Social Construction, Deviance, and Daylight Savings.

Lisa Wade, PhD is an Associate Professor at Tulane University. She is the author of American Hookup, a book about college sexual culture; a textbook about gender; and a forthcoming introductory text: Terrible Magnificent Sociology. You can follow her on Twitter and Instagram.

Cross-posted at Compassionate Societies.

This week the Organization for Economic Co-operation and Development (OECD) released a series of new gender indicators, covering the presence of women in top corporate jobs and parliaments, the gender wage gap, and entrepreneurship.

Despite efforts in many countries to promote their participation on boards, women are still under-represented in top corporate jobs.  On average, women make up 10% of board members. The United States is only 2% higher at 12%. Quite a few countries do better. The highest is highest is Norway, at close to 40%, due to a mandatory quota introduced in 2006. In Sweden, France, Slovak Republic and Finland the proportion of women on boards is between 15% and 20%, while in Germany, Japan and the Netherlands, it is less than 5%.

The percent of women in the U.S. congress and senate is 17%, which is about 10% lower than the average of OCED countries parliaments.  In the past ten years, the average proportions have increased slightly, but significantly.

The overall wage gap in the U.S. has been declining, but at 19%, it is three times greater than it is in Hungary. And it is about twice as large as most European countries.  Overall, the gap has been declining:

Entrepreneurship is still highly gendered.  The percent of women has been rising, but this is largely due to an overall decline in male entrepreneurs during the past 11 years.

If one considers lack of participation in power positions of business as well as government to be indicators of injustice due to social processes like glass ceilings that prohibit advancement, then the U.S., as well as the rest of the OECD countries analyzed here, have a long way to go to reach gender justice, both informal and formal.

————————

Ron Anderson, PhD, emeritus professor of sociology at the University of Minnesota, has written many books and hundreds of articles, mostly on technology. In his retirement, he is doing research and writing on compassion and suffering and maintains the website CompassionateSocieties.org.

Cross-posted at Family Inequality.

The Carsey Institute’s Kristin Smith has written a brief on the plight of home care workers — the home health aides and personal care aides that play a growing role in our patchwork network of care work.

The news now is that these workers are not covered by the Fair Labor Standards Act — which offers the protection of minimum wage and overtime pay — but the U.S. Labor Department has proposed to bring them under its aegis.

According to the Department of Labor:

Many of these workers are the primary breadwinners for their families. Of the roughly 2 million workers who will be affected by this rule, more than 92 percent are women, nearly 50 percent are minorities, and nearly 40 percent rely on public benefits such as Medicaid and food stamps. According to the Bureau of Labor Statistics, home health care aides earn about $21,000 a year and many lack health insurance.

Smith’s analysis uses 2011 federal data. She shows that home care workers are more likely to work overtime, and more likely to work part time, than direct care workers in hospitals and nursing homes:

And they are more likely to be working part time for involuntary reasons:

Finally, their median wages — and the wages of those in the bottom quartile of the occupation — are lower than those of hospital and nursing home workers:

As Nancy Folbre as explained, the economics are bad here. Besides the bad hours, bad pay, bad working conditions, lack of unions and lack of state protections, there are some structural problems. Paid home health care is competing with unpaid family care. That means the decision about whether to pay for professional care weighs against the value of a (usually female) family member’s unpaid work. That drives down the cost of home health care — which means more than a million women get lower wages, and women’s work is devalued. And so on. Breaking that cycle requires either a wage increase (sadly, that includes bringing them under the minimum wage law) or government subsidies.*

——————————

*One attempt to beat these economic odds and support long-term care, the Community Living Assistance Services and Supports Act (CLASS Act), was supposed to be a premium-based long-term care support program, and it was passed as part of Obamacare. However, with the rule that it be self-funding, and solvent, while paying a cash benefit for life to eligible beneficiaries, theadministration said it couldn’t be done after all. Actually paying for care isn’t cheap.

Philip N. Cohen is a professor of sociology at the University of Maryland, College Park, and writes the blog Family Inequality. You can follow him on Twitter or Facebook.

UPDATE:  Since posting this, I’ve discovered that the numbers do not accurately reflect the ratio of CEO vs. worker pay.  Writes PolitiFact:

We don’t doubt the chart’s underlying point that the ratio of CEO pay to worker pay is high in the United States, and is likely higher in our free-wheeling economy than it is in the historically more egalitarian nations of Europe.

But in its claim that the U.S. ratio is 475 to 1, the chart conveys a sense of certitude and statistical precision that simply isn’t warranted — and which is contradicted by the facts. The latest number for the U.S. is 185 to 1 in one study and 325 to 1 in another [though in previous years, those ratios have reached as high as 525 to 1] — and those numbers were not generated by groups that might have an ideological interest in downplaying the gaps between rich and poor. We rate the claim on the U.S. ratio False.

I apologize for not vetting this more carefully.

H/T KeepYourHopesUpHigh via GlobalSociologyBlog.

Lisa Wade, PhD is an Associate Professor at Tulane University. She is the author of American Hookup, a book about college sexual culture; a textbook about gender; and a forthcoming introductory text: Terrible Magnificent Sociology. You can follow her on Twitter and Instagram.