work

Generally speaking, gender equality in the U.S. and other Western countries has involved women moving into men’s spheres.  We have not seen an equivalent migration of men into women’s spheres.  Accordingly, while women have integrated many male occupations (they are now, for example, 50% or more of law and medical students), many female-dominated ones remain heavily female.

This is perhaps nowhere more true than in early childhood education.  In a story about male childcare workers at Organizations, Occupations and Work, Lata Murti reports that only 5% of child care workers and 3% of pre-school teachers are male.  Numbers are also low in other Western countries.  In Germany, the average is 3.5% (and this includes all employees of child care centers, including custodians).

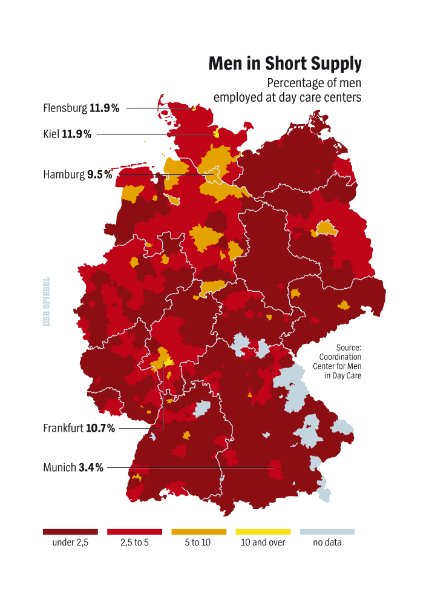
So, Spiegel Online reports, Germany has decided to try to do something about it.  Aiming to increase the percentage of men in child care to 20%, the government is spending 13 million Euros on a “More Men in Early Childhood Education and Care” program.

The state isn’t doing this, though, solely out of a passion for gender equality or a soft place in their heart for men holding babies.  They’re doing it because Germany has promised that there will be a spot in a day care center for all children when they turn one year old.  To fulfill this promise, they need more day care workers badly; recruiting men means that that other half of the population might fill out the profession.

Lisa Wade, PhD is an Associate Professor at Tulane University. She is the author of American Hookup, a book about college sexual culture; a textbook about gender; and a forthcoming introductory text: Terrible Magnificent Sociology. You can follow her on Twitter and Instagram.

In doing research for a book I may write about voluntary childnessness, I came across a telling graphic from the Pew Research Center.  First, note that the percent of women age 40-44 without a biological child has almost doubled since the late ’70s.  Today about one-in-five such women (18%) have never given birth:

The percent of women is even higher among women with professional degrees (a master’s or equivalent and higher).  One-in-four women with a master’s degree, and nearly that many women with PhDs, have no biological children by ages 40-44.

Here’s where the really telling graph comes in.  Though women with higher levels of education are less likely to have biological children than other types of women, the trend  of increasing childlessness shown above doesn’t apply to them.  In fact, women with master’s and PhDs in the most recent data are more likely to have children than their counterparts 14 years ago.  In the first half of the 1990s, nearly one-in-three women with professional degrees did not have biological children; today it’s one-in-four. Childbearing among the most educated women, then, bucks the trend. It has gone up.

The data probably reflect greater endorsement of the idea that a woman can, or should be able to, balance both a career and a family, as well as the rise of policies that make that possible.  University of Florida sociologist Tanya Koropeckyj-Cox, who’s studied this stuff, says as much.  It may be hard to imagine now, but there was a time when having children would destroy a woman’s always-already fragile career; as much as we may love or hate the “mommy track,” at least today there is one.  Koropeckyj-Cox also suggests that women with higher incomes may have greater access to infertility treatments, making overcoming health problems or delayed childbearing more possible for them than it is among women with less education.

In any case, the data suggests an interesting story about gender, childbearing, educational achievement, and historical change.  I’d be happy to hear more interpretation in the comments.

Lisa Wade, PhD is an Associate Professor at Tulane University. She is the author of American Hookup, a book about college sexual culture; a textbook about gender; and a forthcoming introductory text: Terrible Magnificent Sociology. You can follow her on Twitter and Instagram.

Noam sent in this 10 minute film, “What’s a Girl Doing Here?”, by Diana Diroy.  It includes a set of interviews with female cab drivers in New York.  They’re a rare breed.  According to the description by Narratively:

Loud flashes of yellow are all around you in New York—46,000 taxi sedans, vans and SUVs streaking the streets. Yet, only about 170 of them are driven by women, a percentage even lower than the national average.

Lisa Wade, PhD is an Associate Professor at Tulane University. She is the author of American Hookup, a book about college sexual culture; a textbook about gender; and a forthcoming introductory text: Terrible Magnificent Sociology. You can follow her on Twitter and Instagram.

The NFL referees have been on strike.  In their place the league has hired replacements in order to keep the season underway.  Word on the street is that the replacements are doing a distinctly terrible job. Writes Ed at Gin and Tacos:

Since professional and amateur football have different rules — in some cases very different — the results have been predictably disastrous. From their failure to do basic things like spot the ball and operate the game clock to major rules of which they appear to be totally ignorant, they have proven thus far that there is nothing they can’t botch.

Others, too, are finding humor in their ineptitude.

Ed wonders if NFL fans are internalizing the economic lesson in this debacle:

In a surplus labor market you can always find someone willing to do a job for less, but they’re probably not going to do it well. Even the type of person who blames the work stoppage on the union… can’t deny that the end result is the replacement of trained, experienced professionals with a clown car load of knuckleheads who act like they’ve never seen a football before.

He concludes, suggestively: “maybe all human capital is not interchangeable …and maybe there are some noticeable downsides to a market in which whoever will work for the least gets the job.”

The NFL, being entertainment and all, isn’t the best example, but when we apply the same logic to occupations like school teachers and air traffic controllers, we should sit up and notice.  Maybe at this moment, when something so beloved is at stake, it’ll raise America’s consciousness just a little bit.  Ed, for what it’s worth, isn’t optimistic.

Lisa Wade, PhD is an Associate Professor at Tulane University. She is the author of American Hookup, a book about college sexual culture; a textbook about gender; and a forthcoming introductory text: Terrible Magnificent Sociology. You can follow her on Twitter and Instagram.

Cross-posted at Reports from the Economic Front.

Politicians always seem to be talking about the middle class.  They need some new focus groups.  According to the Pew Research Center, over the past four years the percentage of adult Americans that say they are in the lower class has risen significantly, from a quarter to almost one-third (see chart below).

Pew also found that the demographic profile of the self-defined lower class has also changed.  Young people, according to Pew, “are disproportionately swelling the ranks of the self-defined lower classes.”   More specifically some 40% of those between 18 to 29 years of age now identify as being in the lower classs compared to only 25% in 2008.

Strikingly, the percentage of whites and blacks that see themselves in the lower class is now basically equal.  The percentage of whites who consider themselves in the lower class rose from less than a quarter in 2008 to 31% in 2012.  This brought them in line with blacks, whose percentage remained at a third.  The percentage of Latinos describing themselves as lower class rose to 40%, a ten percentage point increase from 2008.

And not surprisingly, as the chart below shows, many who self-identify as being in the lower class are experiencing great hardships.   In fact, 1 in 3 faced four or all five of the problems addressed in the survey.

In short, there is a lot of hurting in our economy.

Cross-posted at Family Inequality.

In 2010, 28% of wives were earning more than their husbands. And wives were 8-times as likely as their husbands to have no earnings.

I still don’t have my copies of The End of Men, by Hanna Rosin, or The Richer Sex, by Liza Mundy. But I’ve read enough of their excerpts to plan out some quick data checks.

Both Rosin and Mundy say women are rapidly becoming primary earners, breadwinners, pants-wearers, etc., in their families. It is absolutely true that the trend is in that direction. Similarly, the Earth is heading toward being devoured by the Sun, but the details are still to be worked out. As Rosin wrote in her Atlantic article:

In feminist circles, these social, political, and economic changes are always cast as a slow, arduous form of catch-up in a continuing struggle for female equality.

Which is right. So, where are we now, really, and what is the pace of change?

For the question of relative income within married-couple families, which is only one part of this picture — and an increasingly selective one — I got some Census data for 1970 to 2010 from IPUMS.

I selected married couples (called “heterogamous” throughout this post) in which the wife was in the age range 25-54, with couple income greater than $0. I added husbands’ and wives’ incomes, and calculated the percentage of the total coming from the wife. The results show and increase from 7% to 28% of couples in which the wife earns more than the husband (defined as 51% or more of the total income):

(Thanks to the NYTimes Magazine for the triumphant wife image)

Please note this is not the percentage of working wives who earn more. That would be higher — Mundy calls it 38% in 2009 — but it wouldn’t describe the state of all women, which is what you need for a global gender trend claim. This is the percentage of all wives who earn more, which is what you need to describe the state of married couples.

But this 51% cutoff is frustratingly arbitrary. No serious study of power and inequality would rest everything on one such point. Earning 51% of the couple’s earnings doesn’t make one “the breadwinner,” and doesn’t determine who “wears the pants.”

Looking at the whole distribution gives much more information. Here it is, at 10-year intervals:

These are the points that jump out at me from this graph:

  • Couples in which the wife earns 0% of the income have fallen from 46% to 19%, but they are still 8-times as common as the reverse — couples where the wife earns 100%.
  • There have been very big proportionate increases in the frequency of wives earning more — such as a tripling among those who earn 50-59% of the total, and a quadrupling among those in which the wife earns it all.
  • But the most common wife-earning-more scenario is the one in which she earns just over half the total. Looking more closely (details in a later post) shows that these are mostly in the middle-income ranges. The poorest and the richest families are most often the ones in which the wife earns 0%.

Maybe it’s just the feminist in me that brings out the stickler in these posts, but I don’t think this shows us to be very far along on the road to female-dominance.

Previous posts in this series…

  • #1 Discussed The Richer Sex excerpt in Time (finding that, in fact, the richer sex is still men).
  • #2 Discussed that statistical meme about young women earning more than young men (finding it a misleading data manipulation), and showed that the pattern is stable and 20 years old.
  • #3 Debunked the common claim that “40% of American women” are “the breadwinners” in their families.
  • #4 Debunked the description of stay-at-home dads as the “new normal,” including correcting a few errors from Rosin’s TED Talk.
  • #5 Showed how rare the families are that Rosin profiled in her excerpt from The End of Men

Cross-posted at Reports from the Economic Front.

The media has focused on the lack of jobs as a major election issue.  But the concern needs to go beyond jobs to the quality of those jobs.

As a report by the National Employment Law Project makes clear, we are experiencing a low wage employment recovery.  This trend, the result of an ongoing restructuring of economic activity, has profound consequences for issues of poverty, inequality, and community stability.

The authors of the report examined 366 occupations and divided them into three equally sized groups by wage.  The lower-wage group included occupations which paid median hourly wages ranging from $7.69 to $13.83.  The mid-wage group range was from $13.84 to $21.13.   The higher-wage group range was from $21.14 to $54.55.

The figure below shows net employment changes in each of these groups during the recession period (2008Q1 to 2010Q1) and the current recovery (2010Q1 to 2012Q1).   Specifically:

  • Lower-wage occupations were 21 percent of recession losses, but 58 percent of recovery growth.
  • Mid-wage occupations were 60 percent of recession losses, but only 22 percent of recovery growth.
  • Higher-wage occupations were 19 percent of recession job losses, and 20 percent of recovery growth.

The next figure shows the lower-wage occupations with the fastest growth and their median hourly wages.  According to the report, three low-wage industries (food services, retail, and employment services) added 1.7 million jobs over the past two years, 43 percent of net employment growth.  According to Bureau of Labor Statistics projections these are precisely the occupations that can be expected to provide the greatest number of new jobs over the next 5-10 years.

 As the final figure shows, the decline in mid-wage occupations predates the recession.  Since the first quarter of 2001, employment has grown by 8.7 percent in lower-wage occupations and by 6.6 percent in higher-wage occupations.  By contrast, employment in mid-wage occupations has fallen by 7.3.


Significantly, as the report also notes, “the wages paid by these occupations has changed. Between the first quarters of 2001 and 2012, median real wages for lower-wage and mid-wage occupations declined (by 2.1 and 0.2 percent, respectively), but increased for higher-wage occupations (by 4.1 percent).”

A New York Times article commenting on this report included the following:

This “polarization” of skills and wages has been documented meticulously… A recent study found that this polarization accelerated in the last three recessions, particularly the last one, as financial pressures forced companies to reorganize more quickly.

“This is not just a nice, smooth process,” said Henry E. Siu, an economics professor at the University of British Columbia… “A lot of these jobs were suddenly wiped out during recession and are not coming back.”

Steady as she goes is just not going to do it and changes in taxes and spending programs, regardless of how significant, cannot compensate for the increasingly negative trends generated by private sector decisions about the organization and location of, as well as compensation for production.

In 1956 sociologist C. Wright Mills published a book titled The Power Elite.  In it, he argued that our democracy was corrupt because the same people exercised power in business, the military, and politics.  This small group, with so many important roles and connections, had an influence on our society that was far out-of-proportion with their numbers.  This, he concluded, was a dire situation.

Fast forward to 2012 and Lambert Strether posted a series of Venn diagrams at Naked Capitalism.  Strether writes:

[This] nifty visualization… shows how many, many people, through the operations of Washington’s revolving door, have held high-level positions both in the Federal government and in major corporations. To take but one example, the set of all Treasury Secretaries includes Hank Paulson and Bob Rubin, which overlaps with the set of all Goldman Sachs COOs. The overlapping is pervasive. Political scientists and the rest of us have names for such cozy arrangements — oligarchy, corporatism, fascism, “crony capitalism” — but one name that doesn’t apply is democracy.

UPDATE: I’ve included a criticism of the methodology after the diagrams; the overlap portrayed here is almost exclusively among Democratic politicians and the diagrams were explicitly intended to point out connections among progressives.

See for yourself:

On the methods for putting together these diagrams, Strether writes about the person who’s behind the diagrams:

Herman’s honest: Her goal is to “expose progressive corporatism,” and — assuming for the sake of the argument that D[emocrat]s are progressive, and that “progressives” are progressive — her chart does exactly that, and very effectively, too.

But what her data does not do is expose corporatism as such; there are very, very few Rs listed; it strains credulity that Hank Paulson was the only high-level GS operative in the Bush administration, for example, and if GS isn’t the R[epublican]s’ favorite bank, there’s surely another.

Hence, Herman’s chart, if divorced from context[2], might lead somebody — say, a child of six — to conclude that the only corporatists in Washington DC are D[emocrat]s.

Thanks to Carolyn Taylor for pointing out the methods bias.

Lisa Wade, PhD is an Associate Professor at Tulane University. She is the author of American Hookup, a book about college sexual culture; a textbook about gender; and a forthcoming introductory text: Terrible Magnificent Sociology. You can follow her on Twitter and Instagram.