work

Cross-posted at Reports from the Economic Front.

With the election over, the news is now focused, somewhat hysterically, on the threat of the fiscal cliff.

The fiscal cliff refers to the fact that at the end of this calendar year several temporary tax cuts are scheduled to expire (including those that lowered rates on income and capital gains as well as payroll taxes) and early in the next year spending cuts are scheduled for military and non-military federal programs.  See here for details on the taxes and programs.

Most analysts agree that if tax rates rise and federal spending is cut the result will be a significant contraction in aggregate demand, pushing the U.S. economy into recession in 2013.

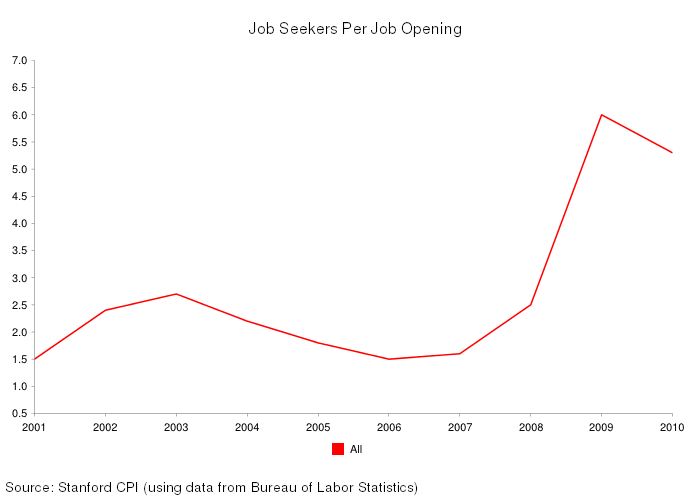
The U.S. economy is already losing steam.  GDP growth in the second half of 2009, which marked the start of the recovery, averaged 2.7% on an annualized basis.  GDP growth in 2010 was a lower 2.4%.  GDP growth in 2011 averaged a still lower 2.0%.  And growth in the first half of this year declined again, to an annualized rate of 1.8%.

With banks unwilling to loan, businesses unwilling to invest or hire, and government spending already on the decline, there can be little doubt that a further fiscal tightening will indeed mean recession.

So, assuming we don’t want to go over the fiscal cliff, what are our choices?

Both Republicans and Democrats face this moment in agreement that our national deficits and debt are out of control and must be reduced regardless of the consequences for overall economic activity.  What they disagree on is how best to achieve the reduction.  Most Republicans argue that we should renew the existing tax cuts and protect the military budget.  Deficit reduction should come from slashing the non-military discretionary portion of the budget, which, as Ethan Pollack explains, includes:

…safety net programs like housing vouchers and nutrition assistance for women and infants; most of the funding for the enforcement of consumer protection, environmental protection, and financial regulation; and practically all of the federal government’s civilian public investments, such as infrastructure, education, training, and research and development.

The table below shows the various programs/budgets that make up the non-security discretionary budget and their relative size.  The chart that follows shows how spending on this part of the budget is already under attack by both Democrats and Republicans.

Unfortunately, the Democrat’s response to the fiscal cliff is only marginally better than that of the Republicans.  President Obama also wants to shrink the deficit and national debt, but in “a more balanced way.”  He wants both tax increases and spending cuts.  He is on record seeking $4 trillion in deficit reduction over a ten year period, with a ratio of $2.50 in spending cuts for every $1 in new revenue.

The additional revenue in his plan will come from allowing tax cuts for the wealthy to expire, raising the tax rate on the top income tax bracket, and limiting the value of tax deductions.  While an important improvement, President Obama is also committed to significant cuts in non-military discretionary spending.  Although his cuts would not be as great as those advocated by the Republicans, reducing spending on most of the targeted programs makes little social or economic sense given current economic conditions.

So, how do we scale the fiscal cliff in a responsible way?

We need to start with the understanding that we do not face a serious national deficit or debt problem.  As Jamie Galbraith notes:

…is there a looming crisis of debt or deficits, such that sacrifices in general are necessary? No, there is not. Not in the short run — as almost everyone agrees. But also: not in the long run. What we have are computer projections, based on arbitrary — and in fact capricious — assumptions. But even the computer projections no longer show much of a crisis. CBO has adjusted its interest rate forecast, and even under its “alternative fiscal scenario” the debt/GDP ratio now stabilizes after a few years.

Actually, as the chart below shows, the deficit is already rapidly falling.  In fact, the decline in government spending over the last few years is likely one of the reasons why our economic growth is slowing so dramatically.

As Jed Graham points out:

From fiscal 2009 to fiscal 2012, the deficit shrank 3.1 percentage points, from 10.1% to 7.0% of GDP.  That’s just a bit faster than the 3.0 percentage point deficit improvement from 1995 to ’98, but at that point, the economy had everything going for it.

Other occasions when the federal deficit contracted by much more than 1 percentage point a year have coincided with recession. Some examples include 1937, 1960 and 1969.

In short, we do not face a serious problem of growing government deficits.  Rather the problem is one of too fast a reduction in the deficit in light of our slowing economy.

As to the challenge of the fiscal cliff — here we have to recognize, as Josh Bivens and Andrew Fieldhouse explain, that:

…the budget impact and the economic impact are not necessarily the same. Some policies that are expensive in budgetary terms have only modest economic impacts (for example, the 2001 and 2003 tax cuts aimed at high-income households are costly but do not have much economic impact). Conversely, other policies with small budgetary costs have big economic impacts (for example, extended unemployment insurance benefits).

In other words, we should indeed allow the temporary tax rate deductions for the wealthy to expire, on both income and capital gains taxes.  These deductions cost us dearly on the budget side without adding much on the economic side.  As shown here and here, the evidence is strong that the only thing produced by lowering taxes on the wealthy is greater income inequality.

Letting existing tax rates rise for individuals making over $200,000 and families making over $250,000 a year, raising the top income tax bracket for both couples and singles that make more than $388,350, and limiting tax deductions will generate close to $1.5 trillion dollars over ten years as highlighted below in a Wall Street Journal graphic .

However, in contrast to President Obama’s proposal, we should also support the planned $500 billion in cuts to the military budget.  We don’t need the new weapons and studies are clear that spending on the military (as well as tax cuts) is a poor way to generate jobs.  For example, the table below shows the employment effects of spending $1 billion on the military versus spending the same amount on education, health care, clean energy, or tax cuts.

defense.jpg

And, we should also oppose any cuts in our non-security discretionary budget. Instead, we should take at least half the savings from the higher tax revenues and military spending cuts — that would be a minimum of $1 trillion — and spend it on programs designed to boost our physical and social infrastructure.  Here I have in mind retrofitting buildings, improving our mass transit systems, increasing our development and use of safe and renewable energy sources like wind and solar, and expanding and strengthening our social services, including education, health care, libraries, and the like.

Our goal should be a strong and accountable public sector, good jobs for all, and healthy communities, not debt reduction.  The above policy begins to move us in the right direction.

—————————

Martin Hart-Landsberg is a professor of Economics and Director of the Political Economy Program at Lewis and Clark College.  You can follow him at Reports from the Economic Front.

In the five minute video below, U.C. Santa Barbara sociologist Richard Appelbaum discusses the global changes that are driving our uncertain economic future.  While economists have rightly focused on many proximate factors, he says, sociologists have emphasized “changing nature of the economy in the world today.”  He offers a quick history of economic transformations throughout human history and then focuses on the ongoing changes that we call “globalization.”  This includes lightning speed communication and extremely fast movement of goods from one part of the world to another.

Globalization, he goes on, has caused a migration of work out of wealthy and into poor countries.  Meanwhile, businesses that have no national boundaries are increasingly independent. Not beholden to any given country, it has become more difficult to regulate industries in ways that benefit any given state and its citizens.

Appelbaum finishes with a quick discussion of what all this means for young people who are educating themselves today with the hopes of a bright future tomorrow.

Video by Norton Sociology.

Lisa Wade, PhD is an Associate Professor at Tulane University. She is the author of American Hookup, a book about college sexual culture; a textbook about gender; and a forthcoming introductory text: Terrible Magnificent Sociology. You can follow her on Twitter and Instagram.

There is growing talk that the economy is finally on its way to recovery — “A Steady, Slo-Mo Recovery” — in the words of Businessweek.

Here is how Peter Coy, writing in Businessweek, explains the growing consensus:

Job growth is poised to continue increasing tax revenue, which will make it easier to shrink the budget deficit while keeping taxes low and preserving essential spending. All this will occur without any magic emanating from the Oval Office. It would have occurred if Mitt Romney had been elected president. “The economy’s operating well below potential, and there’s a lot of room for growth” regardless of who’s in office, says Mark Zandi, chief economist of forecaster Moody’s Analytics.

Something could still go wrong, but the median prediction of 37 economists surveyed by Blue Chip Economic Indicators is that during the next four years, economic growth will gather momentum as jobless people go back to work and unused machinery is put back into service. “The self-correcting forces in the economy will prevail,” predicts Ben Herzon, senior economist at Macroeconomic Advisers, a forecasting firm in St. Louis.

Before we get lulled to sleep, we need some perspective about the challenges ahead.  How about this: we face a 9 million jobs gap between the number of jobs we have and the number we need, and this doesn’t even address the low quality of the jobs being created.

The chart below, taken from an Economic Policy Institute blog post, illustrates the gap.

As Heidi Shierholz, the author of the post, explains:

The labor market has added nearly 5 million jobs since the post-Great Recession low in Feb. 2010. Because of the historic job loss of the Great Recession, however, the labor market still has 3.8 million fewer jobs than it had before the recession began in Dec. 2007. Furthermore, because the potential labor force grows as the population expands, in the nearly five years since the recession started we should have added 5.2 million jobs just to keep the unemployment rate stable. Putting these numbers together means the current gap in the labor market is 9.0 million jobs. To put that number in context: filling the 9 million jobs gap in three years — by fall 2015 — while still keeping up with the growth in the potential labor force, would require adding around 330,000 jobs every single month between now and then.

Unfortunately, our “job creators” only created 171,000 net jobs in October. And that was considered a relatively good month.   The chart below, from the Center on Budget and Policy Priorities,  gives a sense of what we are up against.

Of course, weak job growth in the past doesn’t mean that we cannot have strong job growth in the future.  On the other hand, such a change would require consensus on radically different policies than those currently being discussed and debated by those in power.

—————————

Martin Hart-Landsberg is a professor of Economics and Director of the Political Economy Program at Lewis and Clark College.  You can follow him at Reports from the Economic Front.


While the news often discusses the proportion of the population that is unemployed, sociologists also talk about the working poor (people with full time jobs, but who are paid so little that they remain below the poverty line) and the underemployed (e.g., people who have part-time jobs, but wish they were full-time).

The New York Times recently put together a graphic illustrating the rise of underemployment due to the recession. Overall, the number of people who are working part-time involuntarily has risen.  In the related article, reporter Steven Greenhouse quotes a retail consultant explaining: “Over the past two decades, many major retailers went from a quotient of 70 to 80 percent full-time to at least 70 percent part-time across the industry.”  Underemployment has risen in some economic sectors more than others, notably leisure/hospitality and wholesale/retail:

Among other employers, Greenhouse profiles a Fresh & Easy store in San Diego. Employed there are 5 full-time managers and 17 part-time workers.  Shannon Hardin, who has worked there for five years, averages 28 hours a week and earns $10.90 an hour.

Workers like Hardin often get very short shifts (designed to increase the number of employees in the store only during rush times), irregular schedules (making it difficult to arrange childcare), and last minute requests to work.  Being inflexible can get an employee fired.

This is why employers like part-timers; from the company’s perspective, they’re cheap and flexible:

From the employee’s perspective, of course, it means a meager existence, an uncertain future, and a life led at the whims of a company’s bottom line.

Lisa Wade, PhD is an Associate Professor at Tulane University. She is the author of American Hookup, a book about college sexual culture; a textbook about gender; and a forthcoming introductory text: Terrible Magnificent Sociology. You can follow her on Twitter and Instagram.

Cross-posted at Reports from the Economic Front.

The good economic news, which got plenty of attention, is that the U.S. economy added over 170,000 new jobs in October.  The largely unreported negative news is that average real hourly wages in the private sector declined that month, and have been in decline for most of the past year.

It is hard to remember that the economy has been in expansion since June 2009.

Jeffrey Sparshott, in a Wall Street Journal blog post, offered the following chart of the trend in hourly earnings in private industry, with each point showing the change from a year earlier.

Citing a Labor Department report, Sparshott noted that:

…hours worked were flat [in October] for the fourth straight month. Meanwhile, average hourly earnings for all employees on private payrolls fell by 1 cent to $23.58 in October. Over the past 12 months, earnings have risen a scant 1.6%. That’s not enough to keep up with inflation. The consumer price index was up 2% in September from a year earlier.

It’s even worse for blue-collar workers. Average hourly earnings of private-sector production and nonsupervisory employees edged down by 1 cent to $19.79, only a 1.1% increase over the past year.

The blog post quoted the HSBC’s chief U.S. economist who said:

This is the smallest increase in wages on record for the data going back to 1964. The persistently high level of unemployment over the past few years is clearly restraining wage gains and suppressing any inflationary pressures that might have possibly emanated from the labor market.

It also quoted the chief U.S. economist at J.P. Morgan Chase who said:

This pace of labor income growth may be quite acceptable for corporate profits, but it does pose headwinds for consumer spending growth.

Consumer spending did rise last quarter, helping to boost third quarter U.S. GDP, but this was largely because of a decline in the personal savings rate, which fell from 4.0% in the second quarter to 3.7% in the third.

We clearly don’t have a foundation for a sustained economic recovery, certainly not one that brings benefits to the majority of workers.  Instead of talk about austerity we need a real debate about the best way to strength worker bargaining power.

—————————

Martin Hart-Landsberg is a professor of Economics and Director of the Political Economy Program at Lewis and Clark College.  You can follow him at Reports from the Economic Front.

Fish farming, the raising of fish in captivity, is often seen as a more sustainable way to feed the increasingly global hunger for seafood.  At least, the story goes, it doesn’t contribute to the over-fishing of our oceans.

Right?

The answer turns out to be: not necessarily.  Carnivorous species of farmed fish still need to be fed, so there is  an entire secondary industry: fishing for fish food.  Just about anything that can be caught will do; the mix of sea animals is simply ground up and made into pellets.  So, the fisherman typically catch absolutely everything that they can, sterilizing a small piece of the ocean.  They don’t distinguish between large and small fish (the large they can sell as human food, the small they sell as fish food) or adults and juveniles. By taking the larger fish, they’re taking out populations before they have a chance to reproduce.  You can see how this is a system with a devastating expiration date.

This 9-minute clip from Grinding Nemo covers the environmental impact of this practice, as well as the inhumane working conditions of some of the men hired to work in this industry:

Via Sociology in Focus.

Lisa Wade, PhD is an Associate Professor at Tulane University. She is the author of American Hookup, a book about college sexual culture; a textbook about gender; and a forthcoming introductory text: Terrible Magnificent Sociology. You can follow her on Twitter and Instagram.

The Russell Sage Foundation and the Stanford Center on Poverty and Inequality have put together Recession Trends, an interactive website that lets you create graphs about issues related to the recession. It takes a couple of steps to get to the database (you have to agree to the terms before entering), but once you’re there, you can choose data about a variety of topics — crime, housing, immigration, income, political attitudes, family life, and a lot more. It’s a great way to quickly get an overview of many aspects of life in the U.S.

I looked at the ratio of median family income between African American and White families. Between the early 1970s and 2010, we’ve seen a consistent gap in earnings, with Black median household income hovering between about 52 and 60% that of Whites:

The graph of the mean net worth of the individuals on Forbes’s list of the 400 richest people in the U.S. shows that while they certainly saw their wealth take a tumble during the recession — it fell to a mere $3.3 billion or so — they’re recovering well:

Unsurprisingly, the number of job seekers per job opening went up sharply after 2007; it’s finally starting to drop off slightly, though we still have about 5 people looking for every 1 job that’s available:

You can add more than one dataset for many topics. Here’s the growth in the prison population since 1980, by gender:

There’s lots, lots more. Whatever topic you’re particularly interested in, there’s a good chance there’s something there that’ll grab your attention for a bit.

Gwen Sharp is an associate professor of sociology at Nevada State College. You can follow her on Twitter at @gwensharpnv.

The New York Times‘ Sabrina Tavernise reports that the long term trend of increasing life expectancy has reversed it self among one specific group of people.  Between 1990 and 2008, the life expectancy of White men and women without high school degrees has dropped.  Women have lost five years, men three.

The difference in the life expectancy between men and women without high school degrees and those who complete college are even more striking.  Women with a college degree can expect to live, on average, more than 10 years longer than high school drop outs.  Among men, the gap is even larger, a whopping 13 years.

The words “alarming” and “vexing” were used to describe this drop in life expectancy.  Scholars are still unsure of its causes, but note the stress of balancing work and family, “a spike in prescription drug overdoses among young whites, higher rates of smoking among less educated white women, rising obesity, and a steady increase in the number of the least educated Americans who lack health insurance.”

Ultimately, they argue, as fewer and fewer people fail to graduate from high school, the concentration of disadvantages in those that do are making this population especially vulnerable to all kinds of ills, some of which kill them.

Hat tip to The Global Sociology Blog.

Lisa Wade, PhD is an Associate Professor at Tulane University. She is the author of American Hookup, a book about college sexual culture; a textbook about gender; and a forthcoming introductory text: Terrible Magnificent Sociology. You can follow her on Twitter and Instagram.