politics

Now that we’re in the last full week of the presidential campaign, let’s look at voting patterns in the U.S. Who votes in national elections? And how many of us do so?

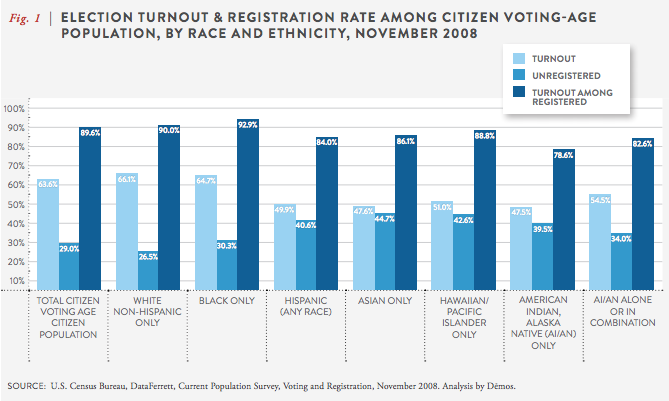
Voter turnout data is often somewhat misleading. The turnout rate is often reported as a % of the total voting-age population — that is, what percentage of people over age 18 voted? But that broad measure of voter turnout will be artificially low because it includes non-citizens living in the U.S., who aren’t eligible to vote. A more accurate measure would be to look at turnout among citizens over age 18; as we see in the data from the 2008 presidential election, the difference between these two measures of voter turnout was more than 5 percentage points:

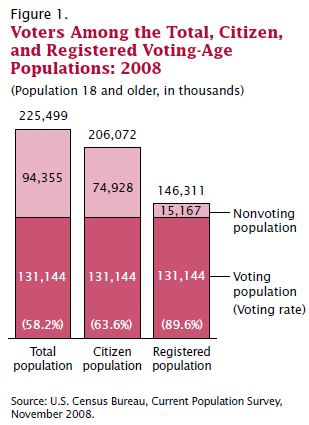
It’s worth noting that the citizen measure doesn’t reflect those citizens who have been disenfranchised because they live in a state where individuals convicted of felonies lose the right to vote, often permanently.

If we look at voter turnout among citizens in 2008, we see significant differences by race/ethnicity. White non-Hispanics have the highest turnout, with African Americans about 5-7 percentage points behind, though the gap narrowed in 2008. Asian Americans and Hispanics are less likely to vote, with just under half of eligible citizens from these two groups voting in 2008:

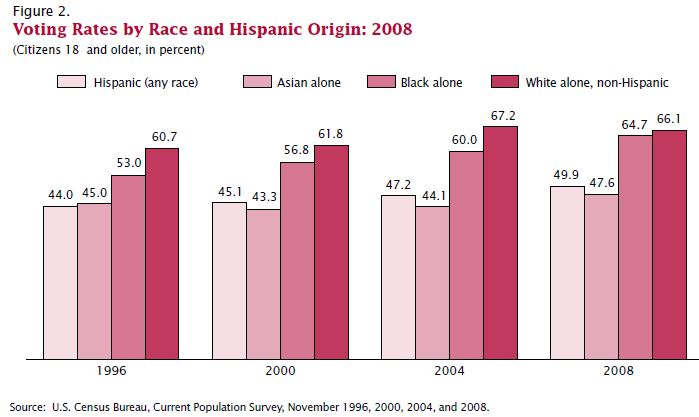
Both parties are keenly aware of the steady growth in voter turnout among Hispanics; as the largest racial/ethnic minority group in the U.S., increasing participation in elections promises growing political influence in the future, a source of both opportunities and challenges for the parties as they vie for those votes.

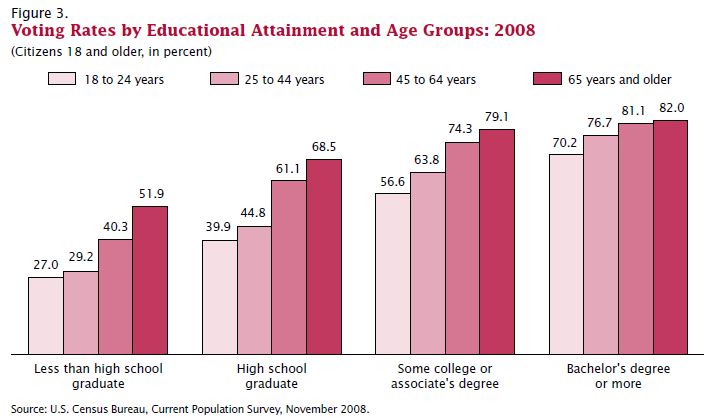
Not surprisingly, age and education affect voting behavior. Within every educational level, the voting rate goes up steadily with age.

For more information on voting patterns, the Census Bureau has an interactive website that lets you select elections between 1996 and 2010 and see a map and graphs broken down by sex, race/ethnicity, age, and so on.

Gwen Sharp is an associate professor of sociology at Nevada State College. You can follow her on Twitter at @gwensharpnv.

Cross-posted at Caroline Heldman’s Blog.

During a debate this past Tuesday, Indiana Republican senate nominee, Richard Mourdock, made the case against the rape exception for abortions: “I’ve struggled with it myself for a long time, but I came to realize that life is that gift from God, and even when life begins in that horrible situation of rape, that it is something that God intended to happen.”

So according to Mourdock, God intends for rape to happen, and the outcome of rape is a gift from God.

What puzzles me is how Mourdock’s rape enthusiast comments fit with Missouri Republican senate candidate Todd Akin’s recent comments that “legitimate rape” (read“forcible rape”) rarely leads to pregnancy because, ”If it’s a legitimate rape, the female body has ways to try to shut that whole thing down.”

Mourdock and Akin’s beliefs, when considered together, produce a bizarre philosophy. I would like to know: Why would God create female bodies that reject God’s “gifts”? And if women don’t get pregnant from “forcible rape,” does that mean that God doesn’t intend ”forcible rapes”? Put another way, does God only intend certain types of rape, you know, the ones that come with “the gift”?

One-in-five Americans agree with Mourdock and Akin’s abortion stance. Razib Khan’sanalysis of the General Social Survey shows that 20% of Americans think abortion should be illegal in cases of rape. Republicans with lower levels of education who identify as extremely conservative and believe the Bible is the word of God are more likely than other Americans to hold this belief.

For Mourdock, Akin, and more than 50 million other Americans, God truly does work in mysterious ways.

Caroline Heldman is a professor of politics at Occidental College. You can follow her at her blog and on Twitter and Facebook.

If you’re paying any attention to the U.S. presidential election, you’ve likely heard a lot about campaign spending on ads. So how much is being spent? And where?

Dmitriy T.C. sent in an interactive graphic that the Washington Post created that allows you to look at one particular type of campaign spending: commercials in various television markets. Spending, and thus exposure to presidential campaign commercials, is very unevenly distributed. Many states get almost no attention from the national campaigns and the interest groups and PACS that support them, since their voting outcomes are seen as all but inevitable.

I, on the other hand, live in the largest city in a swing state; $37 million has been spent on over 47,000 commercials here:

Here’s the key for the map; the darkest green shade indicates more than 20,000 ads, a number roughly equal to how many times I have been called by political pollsters during the past three months:

You can also limit the map to look just at Democratic or Republican spending.

Florida leads the nation in amount spent on TV ads by the two campaigns. The Republicans have outspent the Democrats in all of the top 11 states except New Hampshire:

The site also has a graph that lets you track spending in the most competitive states by week between mid-April and  now.

This is just one element of campaign spending. Add in the cost of all the mailers, campaign trips, online ads, the conventions themselves, and Get out the Vote efforts by the presidential campaigns or interest groups and SuperPACs associated with them, and the amount spent to elect our president is truly mind-boggling.

Gwen Sharp is an associate professor of sociology at Nevada State College. You can follow her on Twitter at @gwensharpnv.

Cross-posted at Caroline Heldman’s Blog.

Last Thursday, Republican Representative and Tea Party favorite, Joe Walsh (R-Ill), told reporters that when it comes to abortion, “there’s no such exception as life of the mother” because of “advances in science and technology.” This astounding claim was news to the medical community.

Walsh joins the ranks of some other prominent Republican men who don’t understand basic lady parts science: Representative Todd Akin (R-MO), who claimed that pregnancy from “legitimate rape” is “really rare” because “the female body has ways to shut the whole thing down,” and conservative comedian Rush Limbaugh, who doesn’t understand the basics of birth control pills. (He thinks you take a pill every time you have sex!)

These remarks would be humorous if it weren’t for the fact that these men are part of a broader effort by the extreme wing of the Republican Party to take aim at women’s reproductive health.

At the state level, Republican lawmakers enacted a record number of anti-abortion measures in 2011, four times as many as the previous year. A study from the Guttmacher Institute shows that legislators in 45 state capitals introduced 944 provisions to limit women’s reproductive health and rights in the first three months of 2012. These states are proposing/passing abortion ultrasound requirements, gestational limits, health insurance exemptions for contraception coverage, and stringent limitations on medical abortions.

In the past two years, 19 states have introduced bills modeled on a Nebraska law that bans abortion 20 weeks after fertilization. The Oklahoma State Senate redefined “person” as starting at conception, while the Mississippi House approved a bill requiring women who want an abortion to undergo an examination to determine if there is a fetal heartbeat. Texas and Virginia require women to undergo an ultrasound prior to receiving an abortion, and many other states have similar proposals underway. Texas recently cut reproductive services for 130,000 poor women.  As this chart from NARAL indicates, twice as many states passed anti-choice laws in 2011 than in 2010.


At the federal level, in 2010, the newly elected House Republican majority was quick to propose major cuts to reproductive health services. They made several attempts to eliminate funding for Planned Parenthood, the largest family planning provider in the U.S. that has been around for a century. They also tried to gut Title X, a program that funds family planning and preventive breast and cervical cancer screenings. Both proposals were stopped by Senate Democrats. Ironically, on the same day that House Republicans tried to eliminate Title X funding, Representative Dan Burton (R-IN) proposed contraceptive funding for wild horses (something that we desperately need, actually).

Congressional Republicans also proposed an amendment to the health care bill that allows federally funded hospitals to turn away women in need of an abortion to save their lives. This is by far the most brazen attack on the “mother’s health” exception to restrictions on abortions. In May of 2012, Republicans proposed a veto on sex-selective abortions that failed to pass the House, despite broad Republican support for the bill. And in early 2012, Republicans in Congress held hearings on whether the new health care law should include contraception coverage. These hearings included virtually no female experts, so House Democrats held more inclusive hearings that (gasp) included women. Limbaugh assailed one hearing participant, Georgetown student Sandra Fluke, calling her a “slut” and a “prostitute.”

Prominent conservatives, including Republican Party leadership, have roundly dismissed the assertion that the party is engaged in a War on Women, but the recent flurry of legislation curbing reproductive freedoms tells a different story. Given baffling comments from the likes of Walsh, Akin, and Limbaugh, the generals in this War on Women obviously need to include lady parts science as part of basic training.

 ——————
Caroline Heldman is a professor of sociology at Occidental College.  You can follow her at her blog and on Twitter and Facebook.

We’re in the home stretch of the presidential election here in the U.S. Many of us now live in states that allow early voting or mail-in absentee voting, but Tuesday, November 6th, is officially Election Day.

But why Tuesday? It doesn’t seem like the most obvious or convenient day to go to the polls; Saturday might seem like a better candidate.

In this short talk, Jacob Soboroff explains the history of why we vote on Tuesdays: in 1845, Congress passed a law setting an official voting day, and didn’t want people to have to travel on Sundays or miss Wednesday market days and so on and so forth, and eventually they settled on Tuesday as the best day to accommodate the travel times required to get places in horse-drawn buggies so people could vote with the minimum disruption to their lives.

And so we still vote on Tuesdays more than a century and a half later, even though, as Selena Simmons-Duffin of NPR pointed out in a story this morning, a lot of critics argue that it reduces voter turnout due to the difficulty of getting off of work to go vote in states that don’t allow any type of early voting.

Gwen Sharp is an associate professor of sociology at Nevada State College. You can follow her on Twitter at @gwensharpnv.

The political humor of Saturday Night Live (SNL) has become a mainstay of modern elections in the United States. The show is especially well known for its impersonations of candidates. However, so far this season SNL’s spoof political advertisement from a fictitious group called Low Information Voters of America is generating the greatest amount of political discussion.

The mock advertisement depicts undecided voters as lacking basic civic knowledge as they ask questions about when the election is held, who is running and whether or not they are an incumbent, how long the president serves, who succeeds the president, and whether or not both sexes can legally vote. SNL presents these few remaining swing voters in a way that implies they might have a problematic amount of influence in a close election.

However, is low information an issue only with just late deciding swing voters, or are they much more prevalent in the United States? A little known Zogby poll conducted in 2006 on a representative sample of adults (+/- 2.9%) in the United States provides some insight about how uniformed voters are by comparing political knowledge to awareness of popular culture.

Whereas 73.8% of respondents correctly named the three stooges; only 42.3% of knew the three branches of the U.S. government. Fifty-six percent knew the name of J.K. Rowling’s Fictional boy wizard; yet only 49.5% correctly identified the Prime Minister of England—and this was during the fallout of Iraq war and Downing Street Memo. Sixty-three percent of those polled could not name one Supreme Court justice; 85% were able to identify at least two of the seven dwarfs. Twice as many respondents (22.6%) knew the last American Idol than the last justice confirmed to the Supreme Court (11.3%).

Democracy needs an informed electorate, although the level of information necessary to maintain an effective republic is open for debate. This poll (which does need to be redone because it is becoming quite dated) finds that many adults in the United States — both the decided and undecided — are more informed about popular culture than politics. Thus, while voters may be “informed enough,” it is still difficult to subjectively claim it is healthy for a democracy to have a populace more knowledgeable about reality television, children’s books and fairy tales than civics.

—————————

Jason Eastman is an Assistant Professor of Sociology at Coastal Carolina University who researches how culture and identity influence social inequalities.

I watched the first U.S. Presidential debate of the election last night and I noticed something interesting about the coverage at CNN.  Notice that the live viewer information along the bottom includes the degree to which female (yellow) and male (green) Colorado undecided voters like or dislike what each candidate is saying (measured by the middle bar).

By choosing to display data by gender, CNN gives us some idea of how men and women agree or disagree on their evaluations of the candidates, but it also makes gender seem like the most super-salient variable by which to measure support.  They didn’t, for example, offer data on how upper and middle class undecided voters in Colorado perceived the debate, nor did they offer data on immigrant vs. non-immigrant, White vs. non-white, gay vs. straight, or any number of demographic variables they could have chosen from.

Instead, by promoting gender as the relevant variable, they also gave the impression that gender was the relevant variable.  This makes it seem like men and women must be really different in their opinions (otherwise, why would they bother highlighting it), strengthening the idea that men and women are different and, even, at odds.  In fact, men and women seemed to track each other pretty well.

It’s not that I don’t think gender is an interesting variable, it’s just that I don’t think it’s the only interesting one and making it seem so is problematic.  I would have loved to have seen the data parsed in other ways too, perhaps by rotating what variables they highlighted.  This would have at least given us a more nuanced view of public opinion (among undecided voters in Colorado) instead of reifying the same old binary.

Lisa Wade, PhD is an Associate Professor at Tulane University. She is the author of American Hookup, a book about college sexual culture; a textbook about gender; and a forthcoming introductory text: Terrible Magnificent Sociology. You can follow her on Twitter and Instagram.

As we enter the home stretch of the presidential campaign, there’s a steady stream of media discussions of potential turnout and differences in early voters and those who vote on Election Day, analysis of the demographics of swing states, and a flood of campaign materials and phone calls aimed at both winning us over and convincing us to actually go vote (those of you not living in swing states may be blessed with less of this).

So who does vote? And how many of us do so?

Demos.org recently released a report on voting rates and access among Native Americans. It contains a breakdown of voting and voter registration by race/ethnicity for the 2008 presidential election. That year, about 64% of all adults eligible to vote in the U.S. did so, but the rates varied widely by group. White non-Hispanics and African Americans had the highest turnout, with every other group having significantly less likely to vote. Half or less of Asians, American Indians/Alaska Natives, and Hispanics voted:

For every group, the vast majority of those who register do go on to vote. But significant numbers of people who have the right to vote aren’t registered to do so, and even among registered voters (the darkest blue columns), turnout is higher among White non-Hispanics and African Americans than other groups. This could reflect lack of interest in or enthusiasm for the election or the candidates, but likely also reflects structural and organizational differences, from poverty to the lack of concerted efforts by campaigns to make voting easier by providing shuttles to the polls and otherwise getting out the vote in these communities.