politics

At Everyday Sociology, sociologist Karen Sternheimer made a nice observation about the problem of teen drinking. It’s not our biggest alcohol problem.

According to the CDC, the age group most likely to die from binge drinking is people 35-64 years old. In fact, three out of every four alcohol poisoning deaths are in this age group — 4.5 out of a total of 6 a day — and 76% of them are men, especially ones who earn over $70,000 a year.777

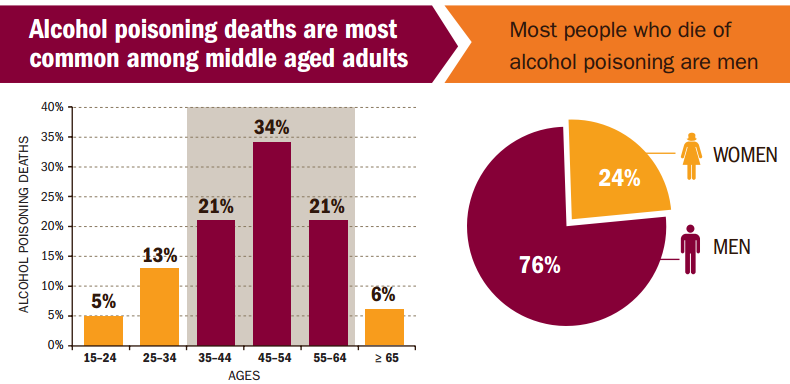
So why all the PSAs aimed at teens?

Sternheimer argues that the focus on teens has to do with who what groups are identified as problematic populations. In the 1800s and early 1900s, she points out, laws were passed in several states making it illegal for African Americans and Native Americans to drink alcohol. Immigrants were also targeted.

Young people weren’t targeted until the student rebellions of the 1960s and ’70s. Like the “protest psychosis” attributed to black Civil Rights activists, the anti-establishment activism of young people was partly blamed on drug and alcohol use.

Today, she observes, the National Institute of Alcohol Abuse and Alcoholism focuses its attention on young people, minorities, women, and people with HIV.

It’s about power. She writes:

White, middle-class men over thirty typically have more social power than the groups commonly targeted as problems. They also vote, and no sane politician is going to campaign warning of the danger some of these men cause and how we can control them.

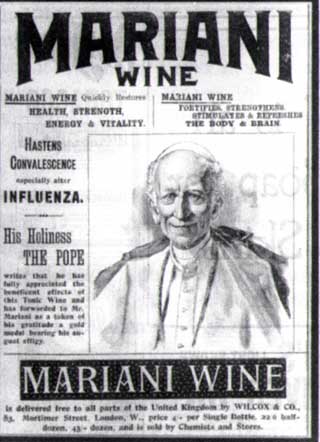
Not to mention, she says, how the alcohol industry would feel about the government telling their richest customers to curb their drinking. They much prefer that PSAs focus on young people. “This industry can well afford the much-touted ‘We Card’ programs,” says Sternheimer, “because teens usually don’t have the money for the expensive stuff that their parents can buy.”

The industry’s marketing to wealthy, white men, then, goes unchecked.

Lisa Wade, PhD is an Associate Professor at Tulane University. She is the author of American Hookup, a book about college sexual culture; a textbook about gender; and a forthcoming introductory text: Terrible Magnificent Sociology. You can follow her on Twitter and Instagram.

Urban planning is a partisan issue. The graph below, produced by the Pew Research Center, shows that the American public are evenly split between small, walkable communities (48%) and sprawling suburbs with McMansions (49%), but that split is strongly partisan.

77% of consistent liberals want to live in neighborhoods where “the houses are smaller and closer to each other, but schools, stores, and restaurants are within walking distance.” In contrast, 75% of consistent conservatives prefer it when “houses are larger and farther apart, but schools, stores, and restaurants are several miles away.”

12

Relatedly, Americans are about evenly split between those who prefer to live in cities, suburbs, small towns, and rural areas, but there is a clear partisan divide.

11

And everyone seems to agree that they want to be near family, good schools, and the outdoors, but liberals are significantly more likely to care if they’re near art museums and theaters.

13

I’m familiar with the idea of the urban liberal and the rural conservative, but I’m still surprised by the strength of these correlations. If the preferences hold true in real life, it means that there is significant partisan residential segregation. That would translate into fewer friendships between people on different sides of the political spectrum, fewer conversations that help them see the others’ point of view, and more cross-group animosity.

In fact, that’s exactly what we see: a strongly partisan population that doesn’t talk to each other very much.

H/t Conrad Hackett. Cross-posted at Pacific Standard.

Lisa Wade, PhD is an Associate Professor at Tulane University. She is the author of American Hookup, a book about college sexual culture; a textbook about gender; and a forthcoming introductory text: Terrible Magnificent Sociology. You can follow her on Twitter and Instagram.

The United States imprisons more people than any other country. This is true whether you measure by percentage of the population or by sheer, raw numbers. If the phrase mass incarceration applies anywhere, it applies in the good ol’ U. S. of A.

It wasn’t always this way. Rates of incarceration began rising as a result of President Reagan’s “war on drugs” in the ’80s (marijuana, for example), whereby the number of people imprisoned for non-violent crimes began climbing at an alarming rate. Today, about one-in-31 adults are in prison. his is a human rights crisis for the people that are incarcerated, but its impact also echoes through the job sector, communities, families, and the hearts of children. One-in-28 school-age children — 2.7 million — have a parent in prison.

2 (1)

In a new book, Children of the Prison Boom, sociologists Christopher Wildeman and Sara Wakefield describe the impact of parental imprisonment on children: an increase in poverty, homelessness, depression, anxiety, learning disorders, behavioral problems, and interpersonal aggression. Some argue that taking parents who have committed a crime out of the family might be good for children, but the data is in. It’s not.

Parental incarceration is now included in research on Adverse Childhood Experiences and it’s particular contours include shame and stigma alongside the trauma. It has become such a large problem that Sesame Street is incorporating in their Little Children, Big Challenges series and has a webpage devoted to the issue. Try not to cry as a cast member sings “you’re not alone” and children talk about what it feels like to have a parent in prison:

Wildeman and Wakefield, alongside another sociologist who researches the issue, Kristin Turney, are interviewed for a story about the problem at The Nation. They argue that even if we start to remedy mass incarceration — something we’re not doing — we will still have to deal with the consequences. They are, Wildeman and Wakefield say, “a lost generation now coming of age.”

The subtitle of their book, Mass Incarceration and the Future of Inequality, points to how that lost generation might exacerbate the already deep race and class differences in America. At The Nation, Katy Reckdahl writes:

One in four black children born in 1990 saw their father head off to prison before they turned 14… For white children of the same age, the risk is one in thirty. For black children whose fathers didn’t finish high school, the odds are even greater: more than 50 percent have dads who were locked up by the time they turned 14…

Even well-educated black families are disproportionately affected by the incarceration boom. Wakefield and Wildeman found that black children with college-educated fathers are twice as likely to see them incarcerated as the children of white high-school dropouts.

After the Emancipation Proclamation, Jim Crow hung like a weight around the shoulders of the parents of black and brown children. After Jim Crow, the GI Bill and residential redlining strangled their chances to build wealth that they could pass down. The mass incarceration boom is just another in a long history of state policies that target black and brown people — and their children — severely inhibiting their life chances.

Hat tip Citings and Sightings. Cross-posted at Pacific Standard.

Lisa Wade, PhD is an Associate Professor at Tulane University. She is the author of American Hookup, a book about college sexual culture; a textbook about gender; and a forthcoming introductory text: Terrible Magnificent Sociology. You can follow her on Twitter and Instagram.

California’s Central Valley is a bread basket of America. It is the source of much of the country’s grapes, tree fruit, nuts, and vegetables. Many of the farms are massive, requiring large amounts of capital, land, and labor.

In the nearby small towns are the homes of the state’s farm laborers. They are primarily Latino. About half are undocumented. Most are poor and few have health care. Politically and economically weak, they are the primary human victims of pesticide drift.

Pesticide drift occurs when chemicals leave the fields for which they’re intended and travel to where humans can be exposed. According to data summarized by geographer Jill Harrison for her article on the topic, California is a pesticide-intensive state. It accounts for 2-3% of all cropland in the U.S., but uses 25% of the pesticides. One in ten of registered pesticides are prone to drift and a third include chemicals that are “highly acutely toxic” or cause cancer, reproductive or developmental disorders, or brain damage. Officially, there are an average of 370 cases of pesticide poisoning due to drift every year, but farmworker advocates say that this captures 10% of the victims at best.

Teresa DeAnda, an environmental justice advocate, stands on the dirt road between an agricultural field and her neighborhood in an image posted at Voices from the Valley.

State officials and representatives of agriculture business minimize pesticide drift; Harrison calls this “down-scaling.” They claim it’s accidental, rare, and not an integral part of the system when it operates well. “Unfortunately from time to time we have tragic accidents,” says one Health Department official. “I think the number of incidents that have occurred given the, are really not that significant…” says another. “The system works,” says an Agricultural Commissioner, “Unfortunately, we have people who don’t follow the law.” All of these tactics serve to make the problem seem small and localized.

It’s not easy to get politicians to pay attention to some of the weakest of their constituents, but activists have made some headway by what Harrison calls “pushing it up the scale.” Contesting its framing it as small problem by virtue of its frequency or impact, they argue that pesticide drift is routine, regular, and systemic. “These things happen every day,” says one resident. “You can smell [the pesticide use],” says another. “You can see it. When you drive, it gets on your windshield.” An activist argues: “The art of pesticide application is not precision delivery. It’s sloppy, and it often spills.” They further contest the downscaling by arguing that pesticide drift is harming the overall air quality. By describing it as air pollution, they make it a state of California problem, one that affects everyone. This makes it more difficult for big agriculture to say it’s no big deal.

Upscaling and downscaling are both part of the politics of scale, a tactic that involves making a problem seem big or little. Harrison notes that many environmentalists advocate a local approach. “The local,’” she writes, “is commonly touted as the space in which people can most directly voice their concerns and effect political change, due to local officials’ proximity to constituents and familiarity with local issues.” This case, though, suggests that justice isn’t one size fits all.

If you’d like to know more the struggle for environmental justice in the San Joaquin Valley, sociologist Tracy Perkins has started a website, called Voices from the Valley. You can also check out Remembering Teresa for more on pesticide drift. Cross-posted at Pacific Standard.

Lisa Wade, PhD is an Associate Professor at Tulane University. She is the author of American Hookup, a book about college sexual culture; a textbook about gender; and a forthcoming introductory text: Terrible Magnificent Sociology. You can follow her on Twitter and Instagram.

Americans have become increasingly critical of public policy as a means of addressing social problems.  Many believe that these policies don’t work; the reality is that public policies are often subverted in ways that make them ineffective or even counterproductive.

Take taxes and inequality.  As Danny Vinik, writing in the New Republic explains:

The vast majority of Americans—both liberals and conservatives—believe that state and local taxes should also be progressive. That’s the finding of a new report released by WalletHub Monday. The researchers surveyed 1,050 Americans on what they thought the combined rate of state and local taxes should be at various income levels. Not surprisingly, liberals want the rate structure to be a bit more progressive than conservatives do, but their responses [as the following chart shows] were relatively similar:

1 (3)

However the reality is quite different.  State and local taxes are actually quite regressive.  The Institute for Taxation and Economic Policy studied the “fairness of state and local tax systems by measuring the state and local taxes that will be paid in 2015 by different [non-elderly] income groups as a share of their incomes.”  They did this state by state and, as presented below, on an overall basis.  As we can see, the lower the income, the greater the state and local tax burden.

1 (4)

Here are some of the report’s key findings:

  • Virtually every state tax system is fundamentally unfair, taking a much greater share of income from low- and middle-income families than from wealthy families. The absence of a graduated personal income tax and overreliance on consumption taxes exacerbate this problem.
  • In the 10 states with the most regressive tax structures (the Terrible 10) the bottom 20 percent pay up to seven times as much of their income in taxes as their wealthy counterparts. Washington State is the most regressive, followed by Florida, Texas, South Dakota, Illinois, Pennsylvania, Tennessee, Arizona, Kansas, and Indiana.
  • Heavy reliance on sales and excise taxes are characteristics of the most regressive state tax systems. Six of the 10 most regressive states derive roughly half to two-thirds of their tax revenue from sales and excise taxes, compared to a national average of roughly one-third . Five of these states do not levy a broad-based personal income tax (four do not have any taxes on personal income and one state only applies its personal income tax to interest and dividends) while four have a personal income tax rate structure that is flat or virtually flat.
  • States commended as “low tax” are often high tax states for low-and middle-income families. The 10 states with the highest taxes on the poor are Arizona, Arkansas, Florida, Hawaii, Illinois, Indiana, Pennsylvania, Rhode Island, Texas, and Washington. Seven of these are also among the “terrible ten” because they are not only high tax for the poorest, but low tax for the wealthiest.

In short, we know how to construct tax policies that can lessen inequality, but we’re not using state and local taxes to do it.

Cross-posted at Reports from the Economic Front and Pacific Standard.

Martin Hart-Landsberg is a professor of economics at Lewis and Clark College. You can follow him at Reports from the Economic Front.

Over the past 40 years, Americans have become increasingly likely to deny an affiliation with a religion. The graph below shows that people with “no religious preference” rose from about 5% of the population in 1972 to about 20% today. Overall, however, Americans do not report a corresponding decline in the a belief in God, life after death, or other religious ideas. What’s going on?

2

Sociologists Michael Hout and Claude Fischer — the guys who made the graph above — argue that the retreat from religious affiliation is essentially, a retreat from the political right. Religion has become strongly associated with conservative politics, so left-leaning people are choosing, instead, to identify as “spiritual but not religious.”

Here is some of their evidence. The data below represents the likelihood of rejecting a religious affiliation according to one’s political views. The more politically liberal one is, the more likely they have come to reject religion.

3

Using fancy statistical analyses, they explain: “generational differences in belief add nothing to explaining the cohort differences in affiliation.” That is, people haven’t lost their faith, they just disagree with religious leaders and institutions.  Hout and Fischer conclude:

Once the American public began connecting organized religion to the conservative political agenda — a connection that Republican politicians, abortion activists, and religious leaders all encouraged — many political liberals and moderates who seldom or never attended services quit expressing a religious preference when survey interviewers asked about it.

Democrats have wondered how to break the association of the right with religion and claim a little bit of moral authority for themselves. It looks like they may not need to or, even, that having failed to do so has a surprise advantage.

Lisa Wade, PhD is an Associate Professor at Tulane University. She is the author of American Hookup, a book about college sexual culture; a textbook about gender; and a forthcoming introductory text: Terrible Magnificent Sociology. You can follow her on Twitter and Instagram.

What do we mean when we say “we”? Or more to the point, what does the president mean when he uses that word?

The Atlantic has an interactive graphic (here) showing the relative frequencies of words in State of the Union addresses. (“Addresses” because I’m choosing my words carefully. These were not “speeches” until Wilson. Before that, it was written text only.) Here “we” is.

The rise of “we” seems to parallel the rise of big government, starting with Wilson and our entry into a world war, followed by a brief (10-year) decline. Then FDR changes everything.  “We,” i.e., the people as represented by the government, are doing a lot more.

Sorting the data by frequency shows that even in the big-We era, big-government Democrats use it more than do Republicans.  (JFK used We less frequently than did the GOP presidents immediately before and after him. But then, it was JFK who said not to ask what the government could do for us.)

Other words are less puzzling. Freedom is a core American value, but of late (the last five or six presidents), it’s the Republicans who really let it ring.

As with We, Freedom gets a big boost with FDR, but Freedom for Reagan and the Bushes is not exactly FDR’s four freedoms – Freedom of speech, Freedom of religion, Freedom from want, Freedom from fear – especially the last two. Nor is it the kind of freedom LBJ might have spoken of in the civil rights era, a freedom that depended greatly on the actions of the federal government.  Instead, for conservatives since Reagan, freedom means the freedom to do what you want, especially to make as much money as you can, unbothered by government rules, and to pay less in taxes.

Freedom in this sense is what Robert Bellah calls “utilitarian individualism.”  As the word count shows, freedom was not such a central concern in the first 150 years of the Republic. Perhaps it became a concern for conservatives in recent years because they see it threatened by big government.  In any case, for much of our history, that tradition of individualism was, according to Bellah, tempered by another tradition – “civic republicanism,” the assumption that a citizen has an interest not just in individual pursuits but in public issues of the common good as well.

That sense of a public seems to have declined. Even the “collectivist” Democrats of recent years use the term only about one-tenth as much as did the Founding Fathers. Washington, Adams, Jefferson, Madison – their SOTUs had more than ten publics for every freedom.

I checked one other word because of its relevance to the argument that the U.S. is “a Christian nation,” founded on religious principles by religious people, and that God has always been an essential part of our nation.

The Almighty, at least in State of the Union addresses, is something of a Johnny-come-lately. Like We, He gets a big boost with the advent of big government. FDR out-Godded everybody before or since, except of course, the Bushes and Reagan.

Thank you and God bless you, and God bless the United States of America.

—————

Update: I just noticed that the two “Gods” in that sentence work out to a rate of 200-300 per million. If tag lines like that are included as part of the text, that accounts for the higher rate since FDR. It’s not about big government, it’s about radio. Prior to radio, the audience for the SOTU was Congress. Starting with FDR, the audience was the American people. Unfortunately, I don’t know whether these closing lines, which have now become standard, are included in the database. If they are included, the differences among presidents in the radio-TV era, may be more a matter of the denominator of the rate (length of speeches) than of the numerator (God). FDR averaged about 3500 per SOTU. Reagan and the Bushes are in the 4000-6000 range. Clinton and Obama average about 7000. So it’s possible that the difference that looks large on the graph is merely the difference between a single God-bless closing and a double.

Jay Livingston is the chair of the Sociology Department at Montclair State University. You can follow him at Montclair SocioBlog or on Twitter.

You may be familiar with the fact that the coca in Coca-Cola was originally cocaine. But did you know that the reason we infused such a beverage with the drug in the first place was because of prohibition? Cocaine cola replaced cocaine wine. In fact, when it was debuted in 1886, it was described as “Coca-Cola: The Temperance Drink.”

The first mass marketed cocaine product was Vin Mariani, a cocaine-infused Bordeaux introduced in the 1860s. Legal and requiring no prescription, it was believed to “restore health and vitality” and I’m sure it felt like it did. Wikipedia reports that it included 7.2 mg of cocaine per ounce; comparatively, a line snorted is about 25 mg.

3 4

Yes, Vin Mariani was good for men, women, and children. The “tonic of kings!” Even the Pope! He loved it so much he called it a “benefactor of humanity” and gave it a Vatican Gold Medal:

2

But he was just the most eminent of its fans. Mariani’s media blitz included endorsements from Sarah Bernhardt, H.G. Wells, Ulysses S. Grant, Queen Victoria, the Empress of Russia, Thomas Edison, and the then-President of the United States, William McKinley. Jules Verne reportedly joked: “Since a single bottle of Mariani’s extraordinary coca wine guarantees a lifetime of 100 years, I shall be obliged to live until the year 2700!”

Vin Mariani dominated the market, but there was an American chemist, John Smith Pemberton, who made a competing product: Pemberton’s French Wine Coca. He described it as an “intellectual beverage.” Pemberton was located in — you guessed it, Atlanta — and the state enacted temperance legislation in 1885. Hence, Coca-Cola was born.

Cross-posted at Pacific Standard.

Lisa Wade, PhD is an Associate Professor at Tulane University. She is the author of American Hookup, a book about college sexual culture; a textbook about gender; and a forthcoming introductory text: Terrible Magnificent Sociology. You can follow her on Twitter and Instagram.