nation: United States

Paraphrasing Donald Rumsfeld, there are things we know and things we don’t know, and things we know we don’t know, and things we don’t know we don’t know.

One thing many working people in American don’t know that they don’t know is how poor our social benefits are compare with those enjoyed by workers in other countries.  No doubt one reason is the general media blackout about worker experiences in other countries.  A case in point: vacation benefits.

The Center for Economic and Policy Research recently completed a study of vacation benefits in advanced capitalist economies.  Here is what the authors found:

The United States is the only advanced economy in the world that does not guarantee its workers paid vacation. European countries establish legal rights to at least 20 days of paid vacation per year, with legal requirements of 25 and even 30 or more days in some countries. Australia and New Zealand both require employers to grant at least 20 vacation days per year; Canada and Japan mandate at least 10 paid days off. The gap between paid time off in the United States and the rest of the world is even larger if we include legally mandated paid holidays, where the United States offers none, but most of the rest of the world’s rich countries offer at least six paid holidays per year.

vacations

Even though paid vacations and holidays are not legally required in the United States, some employers do provide them to their workers. The table below shows the paid vacations and paid holidays offered in the U.S. private sector based on data from the 2012 National Compensation Survey.  The first two columns show the percentage of private sector workers that receive paid leave, vacation and holidays.  The next two columns show the average number of paid vacation and paid holidays provided to those employees that receive the relevant benefit.  The last two columns show the average number of paid vacation and paid holidays for all private sector workers, meaning those that receive and those that do not receive the relevant benefits.

US data

Thus, on average, private-sector workers in the United States receive ten days of paid vacation per year and six paid holidays.  This total still leaves U.S. workers last in the rankings even when compared with the legal minimums highlighted above.  And many employers in these other countries also offer more paid leave than legally required.

Moreover, several countries require additional paid leave for younger and older workers, additions that are also not included in the legal minimums highlighted above.  For example, “in Switzerland, workers under the age of 30 who do volunteer work with young people are entitled to an additional five days of annual leave. Norway offers an additional week of vacation to workers over the age of 60.”

And some countries provide additional leave for workers with difficult schedules.  For example, “Australia offers some shift workers an additional work week of leave. Austria offers workers with ‘heavy night work’ two to three extra days of leave, depending on how frequently they do this shift work, and an additional four days of leave after five years of shift work.”

Several countries offer additional paid leave for jury service, moving, getting married, or community or union work.  For example, “French law guarantees unpaid leave for community work, including nine work days for representing an association and six months for projects of ‘international solidarity’ abroad and leave with partial salary for ‘individual training’ that is less than one year. Sweden requires employers to provide paid leave for workers fulfilling union duties.”

Austria, Belgium, Denmark, Greece, and Sweden even require employers to pay workers at a premium rate while they are on vacation.

There is more to say, but the point should be clear.  Ignorance of experiences elsewhere has narrowed our own sense of possibilities.

Martin Hart-Landsberg is a professor of economics at Lewis and Clark College. You can follow him at Reports from the Economic Front.

Cross-posted at Reports from the Economic Front.

Wealth data is not easy to get.  Still for three years now, Credit Suisse Research Institute has published an annual Global Wealth Databook which attempts to estimate global wealth holdings.  The most recent issue includes data covering 2012.  According to Credit Suisse, the goal “is to provide the best available estimates of the wealth holdings of households around the world for the period since the year 2000.”

According to the publication, global household wealth was $222.7 trillion in mid-2012, equal to $48,500 for each of the 4.6 billion adults in the world.  Wealth is defined as “the marketable value of financial assets plus non-financial assets (principally housing and land) less debts.”

Not surprisingly, as the figure below shows, average global wealth varies considerably across countries and regions.

picture wealth

Also significant are the values of the mean vs the median wealth in each of the countries.  Mean or average wealth is calculated by dividing the total wealth of a country by its adult population.   Median wealth is the wealth holdings of the adult in the middle of the wealth distribution. The median is generally considered a far more reliable indicator of wealth because it is less sensitive to extremes at the top or bottom of the distribution.  The greater the divergence of mean and median wealth, the greater is the wealth inequality.

The table below provides mean and median wealth estimates for those countries with generally reliable data. As you can see, the U.S. ranks high in terms of mean wealth, trailing only 5 countries.  Things are quite different when it comes to median wealth; the U.S. trails 26 countries!  Not surprisingly, then, the U.S. is No. 1 when it comes to the mean/median wealth ratio, or wealth inequality.

global wealth

We clearly dominate in the number of millionaires and the upper global wealth categories.  Are we a wealthy country? Definitely.  Is that wealth concentrated in relatively few hands?  Definitely.

Martin Hart-Landsberg is a professor of economics at Lewis and Clark College. You can follow him at Reports from the Economic Front.

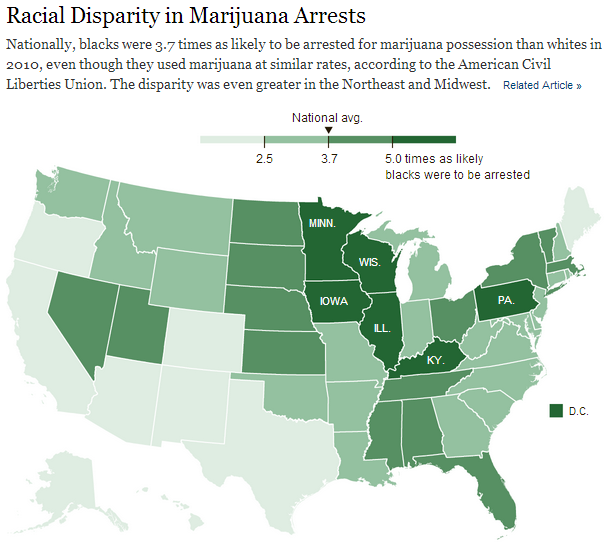
Black Americans are 3.7 times more likely than Whites to be arrested for marijuana possession, despite having equivalent use rates.  It’s a war on what again?

Screenshot_2New York Times, via Gin and Tacos, one of my favorite blogs.

Cross-posted at Racialicious.

Lisa Wade, PhD is an Associate Professor at Tulane University. She is the author of American Hookup, a book about college sexual culture; a textbook about gender; and a forthcoming introductory text: Terrible Magnificent Sociology. You can follow her on Twitter and Instagram.

Cross-posted at Montclair SocioBlog.

According to an op-ed in the Times, America is the global leader in broadband, with high speeds and great service. And it’s all because the government restrained “onerous” regulation and let companies like Verizon do what they want and charge what they want.

It was written by the CEO of Verizon, Lowell McAdam.

I pay Mr. McAdam’s company about $115 each month for my land line, wi-fi, and cable (all FIOS).  Mr. McAdam compares the U.S. favorably with Europe, “where innovation and investment in advanced networks have stagnated under an onerous regulatory regime.”  I asked a friend who lives in Paris what he pays for his FIOS phone, wi-fi, and cable.  The monthly bill:  39.90€ ($52) or half of what I pay Verizon.  Maybe there’s an upside to stagnant and onerous.

There’s nothing wrong with getting what you can afford, and it occurred to me that U.S. broadband is the best because we can afford more.  Onerous regulations or no, most other countries are not as rich as the U.S.  What if you looked at broadband and per capita GDP?

The OECD did just that with data from June 2012 (their several spreadsheets on this are here). The purple bars are broadband penetration and the bumpy red line is GDP per capita. Do you see a correlation?

1

Consider France: As of a year ago, the country had greater broadband penetration despite a lower per capita GDP than the U.S. ($35,133 vs. $46,588); that’s 25% more broadband on 33% less income and at half the cost to consumers.

If you re-rank the OECD countries factoring in per capita GDP, the line-up changes.  Notably, the U.S. and Luxembourg drop well below the OECD average, despite being among the wealthiest countries.

2

Of course, not all broadbands are equally broad.  Verizon sold me on fiber-optic with their assurance that it was dazzlingly faster than their DSL that I had been clunking along on. This graph breaks down broadband into its various incarnations.

3

The U.S. is slightly above average on all broadband, but when it comes to a high fibre diet, we are ahead of several other countries that have greater total penetration.  On the other hand, the Scandinavian countries are ahead of us, as are, impressively, the Asian countries.

This is not to deny U.S. advances.  TechCrunch summarizes more recent data from Akamai on these changes:

the U.S. is currently second in the price of broadband for entry-level users. The nation is also third in network-based competition, second in the fiber-optic installation rate, first in the adoption of next-generation LTE, ahead of Europe in broadband adoption, and doing quite well in Internet-based services.

Still, the U.S. lags behind other, less wealthy countries.  InnovationFiles, using Akamai data for different variables, has a less congratulatory view.

  • The U. S. has picked up one place in the “Average Peak Connection Speed” that’s the best measurement of network capacity, rising from 14th to 13th as the measured peak connection speed increased from 29.6 Mbps to 31.5 Mbps.
  • In terms of the “Average Connection Speed,” widely cited by analysts who don’t know what it means, the U. S. remains in 8th place world-wide. but we’re no longer tied for it as we were in the previous quarter; Sweden is right behind us on this one.
  • In terms of “High Speed Broadband Adoption”, the proportion of IP addresses with an Average Connection Speed greater than 10 Mbps, we remain in 7th place, but now we’re tied with  Sweden.

The title of CEO McAdam’s op-ed is “How the US Got Broadband Right.”  Given the content, I  guess “We’re Number 13!” wouldn’t have been appropriate.  Even “We’re Number Seven (Tied With Socialist Sweden)!” doesn’t quite have that affirmative zing.

Jay Livingston is the chair of the Sociology Department at Montclair State University. You can follow him at Montclair SocioBlog or on Twitter.

Cross-posted at Reports from the Economic Front.

Media and policy-makers seem anxious to convince us that the economy is in strong recovery mode, therefore, no further significant policy interventions are needed.

Their optimism appears to rest heavily on the recent acceleration in consumer spending.  After all, there are strong reasons for concern with the other major sources of growth:  government spending on all levels is being cut, exports face a weakening world economy, and business investment remains largely stagnate.

But there are also strong reasons to challenge this optimistic view of consumer spending as a growth engine.  The charts below, from a Wall Street Journal article, highlight some of the most important.

As we see below, while consumption spending is indeed accelerating, after tax personal income is falling.  In other words, there appears little reason to believe that there is a solid foundation for sustaining this trend.

1

Additionally, after four years of recovery we still have 2.4 million fewer jobs than we had at the start of the recession.  Moreover, as we see below, there has been no real wage growth.  In fact, real average wages have fallen for most of the so-called expansionary period.

2

Yes, housing values are finally starting to rise and household debt payments as a share of after-tax income are declining.  But to a large extent the new burst in consumption spending has more to do with renewed borrowing than solid gains in job creation and income.

Unfortunately, there is little reason for us to have confidence that the economy is gathering strength in ways that will be sustainable or benefit the great majority of working people.

Martin Hart-Landsberg is a professor of economics at Lewis and Clark College. You can follow him at Reports from the Economic Front.

Cross-posted at Family Inequality.

The other day I was surprised that a group of reporters failed to call out what seemed to be an obvious exaggeration by Republican Congresspeople in a press conference. Did the reporters not realize that a 25% unemployment rate among college graduates in 2013 is implausible, were they not paying attention, or do they just assume they’re being fed lies all the time so they don’t bother?

Last semester I launched an aggressive campaign to teach the undergraduate students in my class the size of the US population. If you don’t know that – and some large portion of them didn’t – how can you interpret statements such as, “On average, 24 people per minute are victims of rape, physical violence, or stalking by an intimate partner in the United States.” In this case the source followed up with, “Over the course of a year, that equals more than 12 million women and men.” But, is that a lot? It’s a lot more in the United States than it would be in China. (Unless you go with, “any rape is too many,” in which case why use a number at all?)

1

Anyway, just the US population isn’t enough. I decided to start a list of current demographic facts you need to know just to get through the day without being grossly misled or misinformed – or, in the case of journalists or teachers or social scientists, not to allow your audience to be grossly misled or misinformed. Not trivia that makes a point or statistics that are shocking, but the non-sensational information you need to know to make sense of those things when other people use them. And it’s really a ballpark requirement; when I tested the undergraduates, I gave them credit if they were within 20% of the US population – that’s anywhere between 250 million and 380 million!

I only got as far as 22 facts, but they should probably be somewhere in any top-100. And the silent reporters the other day made me realize I can’t let the perfect be the enemy of the good here. I’m open to suggestions for others (or other lists if they’re out there).

They refer to the US unless otherwise noted:

Description Number Source
World Population 7 billion 1
US Population 316 million 1
Children under 18 as share of pop. 24% 2
Adults 65+ as share of pop. 13% 2
Unemployment rate 7.6% 3
Unemployment rate range, 1970-2013 4% – 11% 4
Non-Hispanic Whites as share of pop. 63% 2
Blacks as share of pop. 13% 2
Hispanics as share of pop. 17% 2
Asians as share of pop. 5% 2
American Indians as share of pop. 1% 2
Immigrants as share of pop 13% 2
Adults with BA or higher 28% 2
Median household income $53,000 2
Most populous country, China 1.3 billion 5
2nd most populous country, India 1.2 billion 5
3rd most populous country, USA 315 million 5
4th most populous country, Indonesia 250 million 5
5th most populous country, Brazil 200 million 5
Male life expectancy at birth 76 6
Female life expectancy at birth 81 6
National life expectancy range 49 – 84 7

Sources:
1. http://www.census.gov/main/www/popclock.html
2. http://quickfacts.census.gov/qfd/states/00000.html
3. http://www.bls.gov/
4. Google public data: http://bit.ly/UVmeS3
5. https://www.cia.gov/library/publications/the-world-factbook/rankorder/2119rank.html
6. http://www.cdc.gov/nchs/hus/contents2011.htm#021
7. https://www.cia.gov/library/publications/the-world-factbook/rankorder/2102rank.html

Philip N. Cohen is a professor of sociology at the University of Maryland, College Park, and writes the blog Family Inequality. You can follow him on Twitter or Facebook.

Cross-posted at Pacific Standard.

Last week the U.S. Supreme Court struck down the part of the Voting Rights Act of 1965 that required states with a documenting history of discrimination to get federal approval before changing their voting laws.  When the law was passed in 1965, one of its main targets were “literacy tests.”

Ostensibly designed to ensure that everyone who voted could read and write, they were actually tools with which to disenfranchise African Americans and sometimes Latinos and American Indians.  Minority voters were disproportionately required to take these tests and, when they did, the election official at the polling place had 100% jurisdiction to decide which answers were correct and score the test as he liked.  The point was to intimidate and turn them away from the polls.  If this sounds bad, you should see the range of disturbing and terrifying things the White elite tried to keep minorities from voting.

The tactics to manipulate election outcomes by controlling who votes is still part and parcel of our electoral politics.  In fact, since most voters are not “swing” voters, some would argue that “turnout” is a primary ground on which elections are fought.  This is not just about mobilizing or suppressing Democrats or Republicans, it’s about mobilizing or suppressing the turnout of groups likely to vote Democrat or Republican.  Since most minority groups lean Democrat, Republicans have a perverse incentive to suppress their turn out. In other words, this isn’t a partisan issue; I’d be watching Democrats closely if the tables were turned.

Indeed, states have already moved to implement changes to voting laws that had been previously identified as discriminatory and ruled unconstitutional under the Voting Act.  According to the Associated Press:

After the high court announced its momentous ruling Tuesday, officials in Texas and Mississippi pledged to immediately implement laws requiring voters to show photo identification before getting a ballot. North Carolina Republicans promised they would quickly try to adopt a similar law. Florida now appears free to set its early voting hours however Gov. Rick Scott and the GOP Legislature please. And Georgia’s most populous county likely will use county commission districts that Republican state legislators drew over the objections of local Democrats.

So, yeah, it appears that Chief Justice John Roberts’ justification that “our country has changed” was pretty much proven wrong within a matter of hours or days.  This is bad.  It will be much more difficult to undo discriminatory laws than it was to prevent them from being implemented and, even if they are challenged and overturned, they will do damage in the meantime.

In any case, here are two examples of literacy tests given to (mostly) minority voters in Louisiana circa 1964.  Pages from history (from Civil Right Movement Veterans):

Louisiana circa 1964a Louisiana circa 1964bThanks to @drcompton for the tip!

Lisa Wade, PhD is an Associate Professor at Tulane University. She is the author of American Hookup, a book about college sexual culture; a textbook about gender; and a forthcoming introductory text: Terrible Magnificent Sociology. You can follow her on Twitter and Instagram.

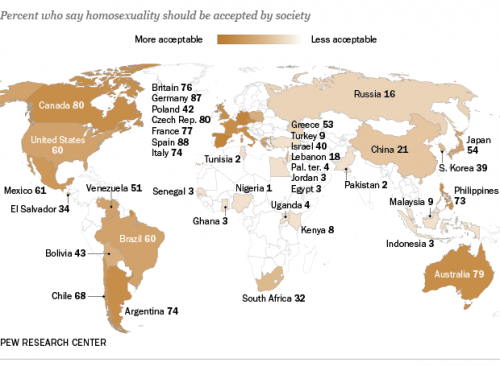
The Pew Research Global Attitudes Project recently released data on attitudes about homosexuality in 39 countries. Generally, those living in the Middle East and Africa were the least accepting, while those in the Americas, Europe, and parts of Asia (the Philippines, Australia, and to a lesser extent Japan) were most accepting:

PG_13.06.04_HomosexualityAccept_620

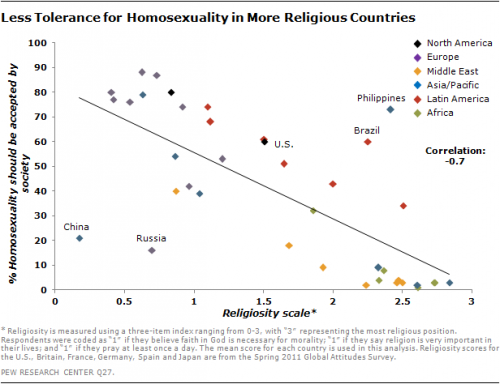
Generally, the more religious a country, the less accepting its citizens are of homosexuality:

2013-Homosexuality-03

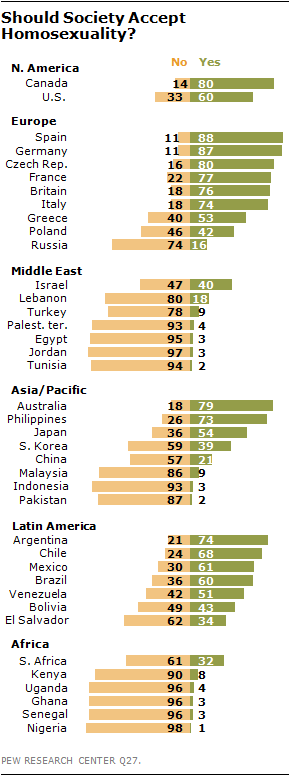
The proportion of people who support social acceptance of gays and lesbians ranged from a high of 88% in Spain to a low of 1% in Nigeria:

2013-Homosexuality-05

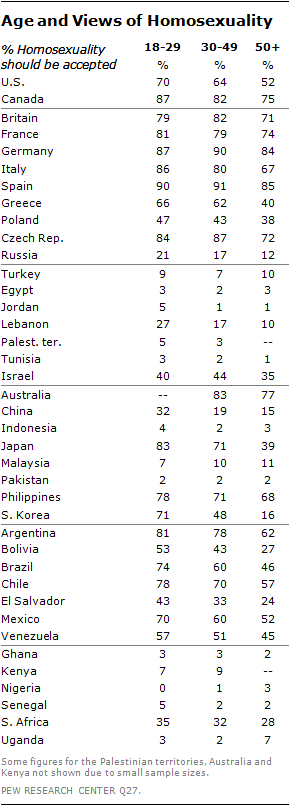
Attitudes about homosexuality vary widely by age. There is a pretty consistent global pattern of more positive attitudes among younger people, with a few exceptions:

2013-Homosexuality-01

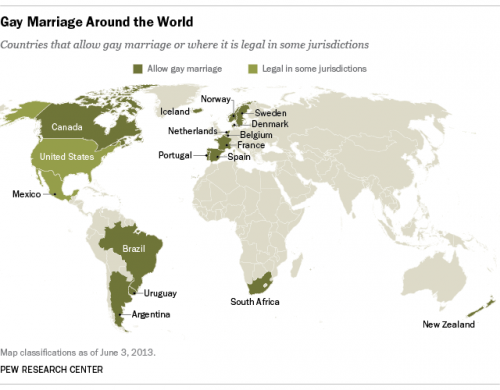
Thus far, legalization of same-sex marriage has been largely confined to the Americas and Europe; New Zealand and South Africa are the two outliers:

FT_13.05.31_gayMarriageMap

The Pew Center points out that of the 15 nations that have fully extended marriage rights to same-sex couples, 8 have done so just since 2010. In the U.S., we’re currently awaiting a Supreme Court’s decision, which should arrive shortly, to know if we’ll be joining the list sooner rather than later.

Thanks to Peter Nardi at Pitzer College for the link!

Gwen Sharp is an associate professor of sociology at Nevada State College. You can follow her on Twitter at @gwensharpnv.