nation: Japan

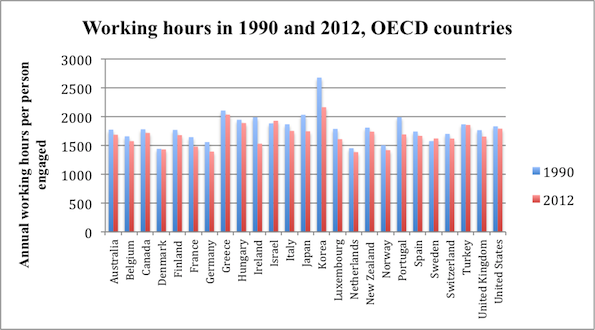
On average, U.S. workers with jobs put in more hours per year  than workers in most OECD countries. In 2012, only Greece, Hungary, Israel, Korea, and Turkey recorded a longer work year per employed person.

2

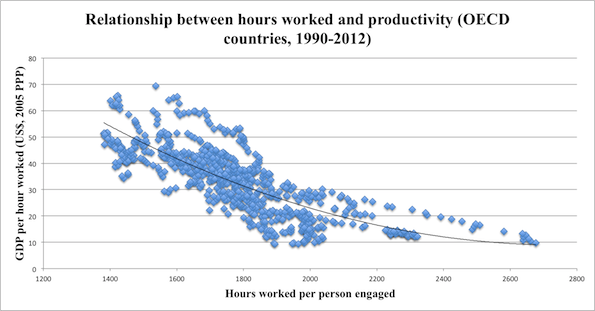
A long work year is nothing to celebrate. The following chart, from the same Economist article, shows there is a strong negative correlation between yearly hours worked and hourly productivity.

3.5

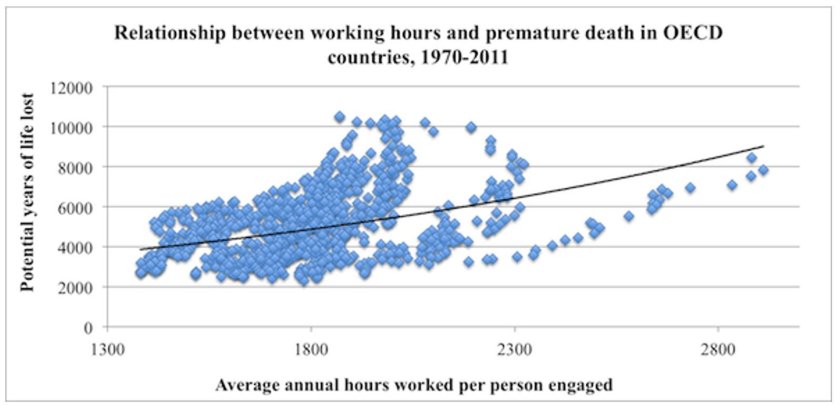
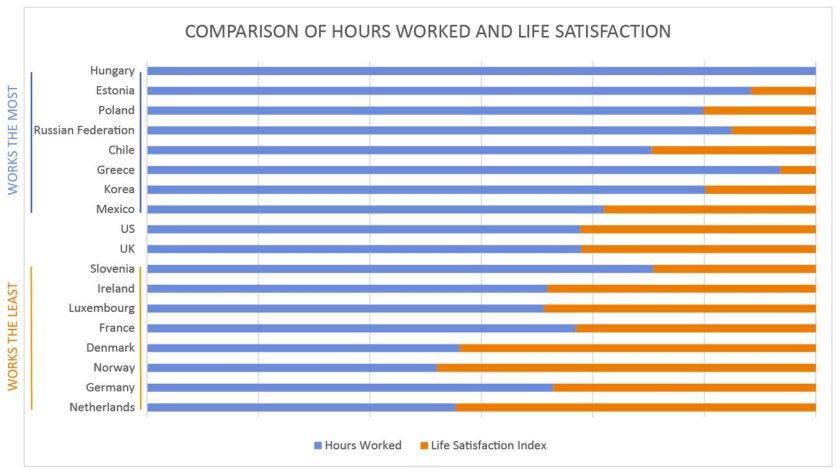
More importantly, the greater the number of hours worked per year, the greater the likelihood of premature death and poor quality of life.  This reality is highlighted in the following two charts taken from an article by Angus Chen titled “8 Charts to Show Your Boss to Prove That You Can Do More By Working Less.”

1 (2) - Copy

1 (2)

In sum, we need to pay far more attention to the organization and distribution of work, not to mention its remuneration and purpose, than we currently do.

Martin Hart-Landsberg is a professor of economics at Lewis and Clark College. You can follow him at Reports from the Economic Front.

Two recent events had a strikingly similar theme.  Kenichi Ebina won America’s Got Talent and Nina Davuluri won Miss America.  In both instances, other Americans objected to their victories, claiming that they were not really American because Ebina and Davuluri are of Japanese and Indian origin respectively.   Still other Americans objected to this reaction.  And yet, as I’ll argue below, most of us share their bias.

First, thanks to Public Shaming, we have examples of the reaction on Twitter.  Reactions to Ebina’s win:

1 2 4

Reactions to Davuluri’s win:
14 12 13

These are stark examples of people who believe that only white people count as American.  It’s a bizarre position, of course, because people of European descent are immigrants to America, and an overtly racist one as well.  I don’t lose any sleep over publishing their identities on this blog.

But, the truth is, the majority of us — even those of us who oppose racism and embrace the idea that the U.S. is a nation of immigrants — hold the belief that America = white.  We just believe this subconsciously.

Project Implicit is an online psychological test that measures implicit beliefs, ones we hold that we’re not necessarily conscious of holding.  One test is of the association of Asian-ness with American-ness.  It works by measuring how long it takes us to sort Asian and European faces and American and Foreign famous sites into the proper categories.

First they ask you to sort faces and places with Asian and Foreign together on the left and European and American together on the right. Like this:

Screenshot_2Then they switch the bottom designations so that Asian and American are on one side and European and Foreign are on the other.  For most people, the harms their ability to sort faces and places: it slows down and includes more errors, revealing that their brain implicitly sees Asian and foreign as one category and American and European as another.

Here’s the aggregate data.  Almost a quarter of people make no association either way, 60% implicitly believe that Asians are less American than Europeans, and 17% think the opposite.

Screenshot_3The take home message is: even though it’s easy to condemn the twits making overtly racist comments, this is a problem that is much more pervasive and pernicious.  Even those of us who are horrified by those tweets likely carry the bias behind them.

Cross-posted at Pacific Standard.

Lisa Wade, PhD is an Associate Professor at Tulane University. She is the author of American Hookup, a book about college sexual culture; a textbook about gender; and a forthcoming introductory text: Terrible Magnificent Sociology. You can follow her on Twitter and Instagram.

Screenshot_2Sorry for the spoiler!  The gaze in the Wacoal commercial below, sent in by Kathe L., dances all over the body of a lovely young woman, focusing especially on the curve of her breast alongside the lace of her bra.  She slowly removes her make-up and disrobes, only to reveal a male body underneath.  The message?  A push-up bra so good it can even give men breasts.

I wonder what y’all think.  Does this queer the body?  Is there a transgressive identity behind the gaze?  Or is it just more gimmicky advertising based on normative expectations?  Both?

Lisa Wade, PhD is an Associate Professor at Tulane University. She is the author of American Hookup, a book about college sexual culture; a textbook about gender; and a forthcoming introductory text: Terrible Magnificent Sociology. You can follow her on Twitter and Instagram.

Paraphrasing Donald Rumsfeld, there are things we know and things we don’t know, and things we know we don’t know, and things we don’t know we don’t know.

One thing many working people in American don’t know that they don’t know is how poor our social benefits are compare with those enjoyed by workers in other countries.  No doubt one reason is the general media blackout about worker experiences in other countries.  A case in point: vacation benefits.

The Center for Economic and Policy Research recently completed a study of vacation benefits in advanced capitalist economies.  Here is what the authors found:

The United States is the only advanced economy in the world that does not guarantee its workers paid vacation. European countries establish legal rights to at least 20 days of paid vacation per year, with legal requirements of 25 and even 30 or more days in some countries. Australia and New Zealand both require employers to grant at least 20 vacation days per year; Canada and Japan mandate at least 10 paid days off. The gap between paid time off in the United States and the rest of the world is even larger if we include legally mandated paid holidays, where the United States offers none, but most of the rest of the world’s rich countries offer at least six paid holidays per year.

vacations

Even though paid vacations and holidays are not legally required in the United States, some employers do provide them to their workers. The table below shows the paid vacations and paid holidays offered in the U.S. private sector based on data from the 2012 National Compensation Survey.  The first two columns show the percentage of private sector workers that receive paid leave, vacation and holidays.  The next two columns show the average number of paid vacation and paid holidays provided to those employees that receive the relevant benefit.  The last two columns show the average number of paid vacation and paid holidays for all private sector workers, meaning those that receive and those that do not receive the relevant benefits.

US data

Thus, on average, private-sector workers in the United States receive ten days of paid vacation per year and six paid holidays.  This total still leaves U.S. workers last in the rankings even when compared with the legal minimums highlighted above.  And many employers in these other countries also offer more paid leave than legally required.

Moreover, several countries require additional paid leave for younger and older workers, additions that are also not included in the legal minimums highlighted above.  For example, “in Switzerland, workers under the age of 30 who do volunteer work with young people are entitled to an additional five days of annual leave. Norway offers an additional week of vacation to workers over the age of 60.”

And some countries provide additional leave for workers with difficult schedules.  For example, “Australia offers some shift workers an additional work week of leave. Austria offers workers with ‘heavy night work’ two to three extra days of leave, depending on how frequently they do this shift work, and an additional four days of leave after five years of shift work.”

Several countries offer additional paid leave for jury service, moving, getting married, or community or union work.  For example, “French law guarantees unpaid leave for community work, including nine work days for representing an association and six months for projects of ‘international solidarity’ abroad and leave with partial salary for ‘individual training’ that is less than one year. Sweden requires employers to provide paid leave for workers fulfilling union duties.”

Austria, Belgium, Denmark, Greece, and Sweden even require employers to pay workers at a premium rate while they are on vacation.

There is more to say, but the point should be clear.  Ignorance of experiences elsewhere has narrowed our own sense of possibilities.

Martin Hart-Landsberg is a professor of economics at Lewis and Clark College. You can follow him at Reports from the Economic Front.

The Pew Research Global Attitudes Project recently released data on attitudes about homosexuality in 39 countries. Generally, those living in the Middle East and Africa were the least accepting, while those in the Americas, Europe, and parts of Asia (the Philippines, Australia, and to a lesser extent Japan) were most accepting:

PG_13.06.04_HomosexualityAccept_620

Generally, the more religious a country, the less accepting its citizens are of homosexuality:

2013-Homosexuality-03

The proportion of people who support social acceptance of gays and lesbians ranged from a high of 88% in Spain to a low of 1% in Nigeria:

2013-Homosexuality-05

Attitudes about homosexuality vary widely by age. There is a pretty consistent global pattern of more positive attitudes among younger people, with a few exceptions:

2013-Homosexuality-01

Thus far, legalization of same-sex marriage has been largely confined to the Americas and Europe; New Zealand and South Africa are the two outliers:

FT_13.05.31_gayMarriageMap

The Pew Center points out that of the 15 nations that have fully extended marriage rights to same-sex couples, 8 have done so just since 2010. In the U.S., we’re currently awaiting a Supreme Court’s decision, which should arrive shortly, to know if we’ll be joining the list sooner rather than later.

Thanks to Peter Nardi at Pitzer College for the link!

Gwen Sharp is an associate professor of sociology at Nevada State College. You can follow her on Twitter at @gwensharpnv.

Cross-posted at Montclair SocioBlog.

Forty years ago Richard Easterlin proposed the paradox that people in wealthier countries were no happier than those in less wealthy countries.  Subsequent research on money and happiness brought modifications and variations, notably that within a single country, while for the poor, more money meant fewer problems, for the wealthier people — those with enough or a bit more — enough is enough.  Increasing your income from $100,000 to $200,000 isn’t going to make you happier.

It was nice to hear researchers singing the same lyrics we’ll soon be hearing in commencement speeches and that you hear in Sunday sermons and pop songs (“the best things in life are free”; “mo’ money mo’ problems”).  But this moral has a sour-grapes taste; it’s a comforting fable we non-wealthy tell ourselves all the while suspecting that it probably isn’t true.

A recent Brookings paper by Betsey Stevenson and Justin Wolfers adds to that suspicion.  Looking at comparisons among countries and within countries, they find that when it comes to happiness, you can never be too rich.

1

Stevenson and Wolfers also find no “satiation point,” some amount where happiness levels off despite increases in income.  They provide US data from a 2007 Gallup survey:

2

The data are pretty convincing.  Even as you go from rich to very rich, the proportion of “very satisfied” keeps increasing.  (Sample size in the stratosphere might be a problem: only 8 individuals reported annual incomes over $500,000;100% of them, though, were “very happy.”)

Did Biggie and Alexis get it wrong?

Around the time that the Stevenson-Wolfers study was getting attention in the world beyond Brookings, I was having lunch with a friend who sometimes chats with higher ups at places like hedge funds and Goldman Sachs.  He hears wheeler dealers complaining about their bonuses. “I only got ten bucks.”  Stevenson and Wolfers would predict that this guy’s happiness would be off the charts given the extra $10 million.  But he does not sound like a happy master of the universe.

I think that the difference is more than just the clash of anecdotal and systematic evidence.  It’s about defining and measuring happiness.  The Stevenson-Wolfers paper uses measures of “life satisfaction.”  Some surveys ask people to place themselves on a ladder according to “how you feel about your life.”  Others ask

All things considered, how satisfied are you with your life as a whole these days?

The GSS uses happy instead of satisfied, but the effect is the same:

Taken all together, how would you say things are these days – would you say that you are very happy, pretty happy, or not too happy?

When people hear these questions, they may think about their lives in a broader context and compare themselves to a wider segment of humanity.  I imagine that Goldman trader griping about his “ten bucks” was probably thinking of the guy down the hall who got twelve.  But when the survey researcher asks him where he is on that ladder, he may take a more global view and recognize that he has little cause for complaint.  Yet moment to moment during the day, he may look anything but happy.  There’s a difference between “affect” (the preponderance of momentary emotions) and overall life satisfaction.

Measuring affect is much more difficult — one method requires that people log in several times a day to report how they’re feeling at that moment — but the correlation with income is weaker.

In any case, it’s nice to know that the rich are benefitting from getting richer.  We can stop worrying about their being sad even in their wealthy pleasure and turn our attention elsewhere.  We got 99 problems, but the rich ain’t one.

Jay Livingston is the chair of the Sociology Department at Montclair State University. You can follow him at Montclair SocioBlog or on Twitter.

The  International Society of Aesthetic Plastic Surgeons has released new data on the incidence of invasive and non-invasive cosmetic procedures.  The U.S. leads in sheer numbers of procedures but, accounting for population, we fall into 4th place.  South Korea leads for the number of procedures per person, followed by Greece and Italy.

1

By far the most common kinds of surgical cosmetic procedures are lipoplasty and breast augmentation.  Along with fat, breasts seem to be a particular concern: breast lifts and breast reductions for both men and women are also in the top ten.  Abdominoplasty, nose jobs, eyelid surgeries, and facelifts are as well.

2

The incidence of these surgeries is strongly related to everything from the gender binary to global power dynamics.  In 2008 we reported that male breast reductions were the most common cosmetic surgery for 13-19 year olds (boys and girls combined). You would be shocked at what counts as excess breast tissue and how little the before and after photos look.  Boys and men getting breast reductions, alongside women getting augmentations, is obviously about our desire for men and women to be different, not naturally-occurring difference.  See The Story of My Man-Boobs for more.

Likewise, we’ve posted about surgeries that create an epithelial fold, a fold of skin in the eyelid more common in people with White than Asian ethnic backgrounds.  This surgery is a trend among Asians and Asian-Americans, as colonization has left us with an association between Whiteness, attractiveness, and power.

The Economist summarizes some other trends:

Breast augmentation, the second biggest surgical procedure, is most commonly performed in America and Brazil. Buttock implants are also a Brazilian specialty, as is vaginal rejuvenation. Asia is keen on nose jobs: China, Japan and South Korea are among the top five nations for rhinoplasty.

More on where and how many procedures are being performed, but nothing on why, at the ISAPS report.

Image at The Economist; via Global Sociology.

Lisa Wade, PhD is an Associate Professor at Tulane University. She is the author of American Hookup, a book about college sexual culture; a textbook about gender; and a forthcoming introductory text: Terrible Magnificent Sociology. You can follow her on Twitter and Instagram.

Originally posted in 2010. Re-posted in honor of the holiday.

This morning I heard an interesting story on NPR about the celebration of Valentine’s Day in Japan.

In the U.S., Valentine’s Day is pretty much for women. While women do give Valentine’s gifts to male partners, the emphasis among adults is on men giving items to women: flowers, candy, cards, taking them out to dinner, and so on. In many cases women aren’t expected to reciprocate, or can give a less expensive/significant present, and I doubt many give flowers or chocolate in heart-shaped boxes.

In Japan, however, the roles are reversed: women give chocolates to men, as well as often buying gifts and providing meals. It apparently isn’t entirely clear how this tradition emerged.

There are two types of chocolates that women give men. Giri-choco, or “obligation chocolate,” is relatively cheap and is what you give to coworkers and the like. Honmei-choco is higher-quality chocolate reserved for men a woman is close to–partners or perhaps a family member. Some women choose to make their own honmei.

Men aren’t off the hook, however. A month later, on March 14th, is White Day, a day when men give candy and other gifts to women. According to wikipedia, these gifts are supposed to be more expensive than what the men received on Valentine’s Day.

A lot of websites say that White Day was invented by a marshmallow company in the ’60s as a way to increase sales, but I can’t find any reliable source for this explanation.

It’s a good example of the social construction of holidays and food. In the U.S., chocolate is highly feminized–we think of it as a food that women particularly like, and ads about chocolate, especially fancy chocolates, are usually aimed at women (or men buying for them). Valentine’s Day and big heart-shaped boxes with large bows on them are likewise feminized. Valentine’s Day is, primarily, a day when men are expected to show their affection for women through the purchase of these things (and, as a side note, the chocolate that comes in those heart-shaped boxes is often pretty unappealing). Insofar as women reciprocate with gifts for men, they’re unlikely to come in a similar heart-shaped box. When I brought up this possibility to my students, they said that would be really unusual and the male recipient would probably feel strange about it.

In Japan, clearly chocolates for Valentine’s Day (even expensive, fancy chocolate), heart-shaped boxes, and big bows are considered appropriate gifts for men. It makes it clear how our association of chocolate with women is culturally specific.

Of course, the fact that on White Day men are supposed to give women more expensive gifts than they received indicates that, while Valentine’s Day specifically is for men, the expectation is that overall, the balance of gift-giving requires men to show more affection-via-spending, similar to U.S. expectations surrounding the holiday.

Other posts: the social construction of chocolate and marketing chocolate to men.

Gwen Sharp is an associate professor of sociology at Nevada State College. You can follow her on Twitter at @gwensharpnv.