history

Cross-posted at Global Policy TV.

Title IX, an amendment to the Civil Rights Act of 1964, stated that “No person in the United States shall, on the basis of sex, be excluded from participation in, be denied the benefits of, or be subjected to discrimination under any education program or activity receiving Federal financial assistance…”  Passed on this day in 1972, this policy meant that schools and colleges receiving federal funding could not legally give preference to men.  Instead, they had to allocate their resources to men and women in proportion to their interest and enrollment.

The intention of the policy was to change the norms that gave preference to men in all sorts of fields, from medical schools to sports teams.  Because most schools and colleges have extensive athletics departments, sports was included among the resources that the schools were required to dole out fairly.

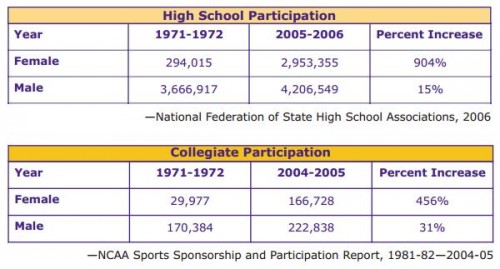
Accordingly, even grudging and partial compliance with the requirements of Title IX dramatically increased the opportunity for women to play sports.  In the next 35 years, women’s participation in high school and college sports would increase by 904% and 456% respectively (source).  Today, 42% of high school athletes and 45% of college athletes are women (source).

Title IX is often mistakenly accused of forcing schools to cut funding for men’s athletics.  In fact, funding for men’s athletics, as well as the number of men who play sports in school, has increased since Title IX.  The chart above also shows that men’s participation has increased by 15% in high school and 31% in college.  It’s not true, then, that Title IX has led to fewer male athletes (especially because some colleges count men as women).  Still, there is great resistance to the Amendment, with a particular emphasis on sports.  Many schools are only marginally compliant, and then only because (tireless) Title IX Officers keep pressure on institutions to follow the law.

It will be fascinating to see how changing college demographics affect the politics around Title IX.  After all, forty years later, people still argue that it’s not right that women’s sports get (almost) as much funding men’s.  Now there are more women on college campuses than men, so proportional funding may mean spending more money on women’s sports than men’s.  Fire and brimstone upon us.

Lisa Wade, PhD is an Associate Professor at Tulane University. She is the author of American Hookup, a book about college sexual culture; a textbook about gender; and a forthcoming introductory text: Terrible Magnificent Sociology. You can follow her on Twitter and Instagram.

The phrase “service economy” — commonly used to describe the U.S. economic profile these days — refers to a decrease in manufacturing (where we make things for people) and an increase in the service sector (where we do stuff for people).

Planet Money put together stacked bar graphs to illustrate the increasing importance of service in our economy (1972 on the left, 2012 on the right).  Manufacturing (making things) is in yellow, so you can clearly see its decline in prominence.  Service sectors include “professional and business services,” “leisure and hospitality,” and “education and health services.”

So, when people talk about the move to a service economy, these are the changes they’re talking about.  We also see the “servitization of products” (don’t you love academics?), or a tendency for products to come with more and more service.  A restaurant, for example, offers a product (made by the chef), but also a degree of service (offered by the wait staff).  Both the quality of the food and the service vary as you move from fast food restaurants to high end eateries. When we see a servitization of products, we see a ratcheting up of the level of expected service that attends any given product.

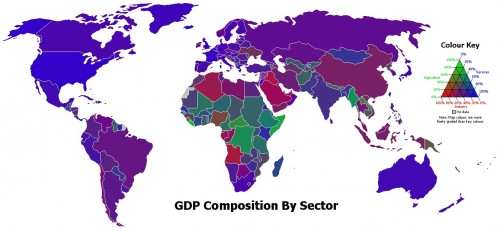
The U.S. economy, by the way, is more heavily characterized by service than most of the world.  The map below is colored to indicate the relative balance between service (blue), manufacturing (red), and agricultural (green) industries in each state.  You can see that the U.S. is among the bluest country on the map:

One of the concerns with the move to a service economy is that service jobs on the low end of the occupational hierarchy tend to be “bad” jobs, while manufacturing jobs, even when they’re on the low end, tend to be “good.”  Service jobs are “bad” in the sense that they tend to have low wages, underemployment, little chance for advancement, and poor or no benefits.  We’re talking, here, about jobs in sales, cashiering, food preparation, and the like.  Because of this tendency, the move to a service economy is taking some of the blame for the shrinking of the middle class.

Lisa Wade, PhD is an Associate Professor at Tulane University. She is the author of American Hookup, a book about college sexual culture; a textbook about gender; and a forthcoming introductory text: Terrible Magnificent Sociology. You can follow her on Twitter and Instagram.

In capitalism, owners of the “means of production” (things like land, factories, technologies, and natural resources, or the money to buy these things) employ labor to do the work of actually producing things.  If the system is working correctly, the value of the labor that goes into making something is worth less than the value of the thing.  This way the capitalist can sell the thing, pay the worker, and skim some profit off the top.

But how much profit?  In a less exploitative system, the worker is paid close to what his work is worth (after accounting for the expenses of maintaining the means of production). In a more exploitative system, the capitalist takes a larger chunk of the enhanced value for himself and gives less to the worker.

What kind of system do we have in the U.S.?  Let’s take a look at some data.

Over at Reports from the Economic Front, Martin Hart-Landsberg posted this graph. It shows that  workers have become increasingly productive since 1948 (i.e., they have created more and more surplus value).  Employers largely shared the increase in profitability with their workers… until the mid-1970s.  Since then, wages have remained stagnant even as worker productivity has continued to rise.  “In other words,” Hart-Landsberg writes, “the owners of the means of production have basically stopped sharing gains in output with their workers.”

You wonder why the middle class is shrinking?  This is one reason.

Lisa Wade, PhD is an Associate Professor at Tulane University. She is the author of American Hookup, a book about college sexual culture; a textbook about gender; and a forthcoming introductory text: Terrible Magnificent Sociology. You can follow her on Twitter and Instagram.

Cross-posted at Montclair SocioBlog.

Air pollution is what economists call an “externality.”  It is not an intrinsic part of the economic bargaining between producers and consumers.  The usual market forces — buyers and sellers pursuing their own individual interests — won’t help.  The market may bring us more goods at lower prices, for example, but it can harm the air that everyone, in or out of that market, has to breathe. To create or protect a public good, the free market has to be a little less free.  That’s where government steps in.  Or not.

Case in point: My son and his girlfriend arrived in Beijing ten days ago.  The got-here-safely e-mail ended with this:

…was blown away by the pollution! I know people talk about it all the time, but it really is crazy.

And it is.  Here’s a photo I grabbed from the Internet:

Flickr creative commons by nasus89.

At about the same time, I came upon a this link to photos of my home town Pittsburgh in 1940.  Here are two of them:
Today in downtown Pittsburgh, the streetcars and overhead trolleys are gone.  So are the fedoras.  And so is the smoke.

The air became cleaner in the years following the end of the War.  It didn’t become clean all by itself, and it didn’t become clean because of free-market forces.  It got clean because of government — legislation and regulation, including an individual mandate.

The smoke was caused by the burning of coal, and while the steel mills accounted for some of the smoke, much of the it came from coal-burning furnaces in Pittsburghers’ houses.  If the city was to have cleaner air, the government would have to force people change the way they heated their homes.  And that is exactly what the law did. To create a public good — clean air — the law required individuals to purchase something — either non-polluting fuel (oil, gas, or smokeless coal) or smokeless equipment.*

Initially, not everyone favored smoke control, but as Pittsburgh became cleaner and lost its “Smoky City” label, approval of the regulations increased, and there was a fairly rapid transition to gas heating.  By the 1950s, nobody longed for the unregulated air of 1940.  Smoke control was a great success.**  Of course, it may have helped that Pittsburgh did not have a major opposition party railing against this government takeover of home heating or claiming that smoke control was a jobs-killing assault on freedom.

————————

* Enforcement focused not on individuals but distributors.  Truckers were forbidden from delivering the wrong kind of coal.

** For a fuller account of smoke control in Pittsburgh, see Joel A. Tarr and Bill C. Lamperes, Changing Fuel Use Behavior and Energy Transitions: The Pittsburgh Smoke Control Movement, 1940-1950: A Case Study in Historical Analogy. Journal of Social History , Vol. 14, No. 4, Special Issue on Applied History (Summer, 1981), pp. 561-588.

Jay Livingston is the chair of the Sociology Department at Montclair State University. You can follow him at Montclair SocioBlog or on Twitter.

In the late 1940s and 1950s, sex researcher Alfred Kinsey estimated that about 10% of the population was something other than straight (and then, as now, a much larger number have same sex experiences or attraction).  Today scholars believe that about 3.5% of the U.S. population identify as gay, lesbian or bisexual, a considerably lower number.  Yet, a telling poll by Gallup shows that Americans wildly — wildly — overestimate the number of people who identify as non-heterosexual:

The table shows that more than a third of Americans believe that more than one out of every four people identifies as gay or lesbian.  Only 4% of Americans answered “less than 5%,” the correct answer.

Estimates varied by demographics and political leaning. Liberals were more likely to overestimate, as were younger people, women, Southerners, and people with less education and income:

Interestingly, these numbers are higher than in 2008, when Gallup asked a similar questions. In that poll, only a quarter of the respondents choose “more than 25%” and more than twice as many said that they had “no opinion.”

Gallup concludes: “…it is clear that America’s gay population — no matter the size — is becoming a larger part of America’s mainstream consciousness.”

Lisa Wade, PhD is an Associate Professor at Tulane University. She is the author of American Hookup, a book about college sexual culture; a textbook about gender; and a forthcoming introductory text: Terrible Magnificent Sociology. You can follow her on Twitter and Instagram.

On this day in 1963 the U.S. Congress passed the Equal Pay Act, a law designed to end wage discrimination against women.

How to get the word out? Advertising of course!

Thanks to Sean D. for the link!

Lisa Wade, PhD is an Associate Professor at Tulane University. She is the author of American Hookup, a book about college sexual culture; a textbook about gender; and a forthcoming introductory text: Terrible Magnificent Sociology. You can follow her on Twitter and Instagram.

Cross-posted at Montclair SocioBlog.

If a person thinks that the media are infiltrating his mind and controlling his thoughts and behavior, we consider him a nutjob, and we recommend professional help and serious meds.  But if a person thinks that the media are infiltrating other people’s minds and affecting their behavior, we call him or her an astute social observer, one eminently qualified to give speeches or write op-eds.

The previous post dwelt on economist Isabel Sawhill’s Washington Post op-ed channeling Dan Quayle, particularly Quayle’s speech asserting that a TV sitcom was wielding a strong effect on people’s decisions — not just decisions like Pepsi vs. Coke, but decisions like whether to have a baby.

That was Quayle, this is now.  Still, our current vice-president can sometimes resemble his counterpart of two decades ago.  Just a last month, Joe Biden echoed the Quayle idea on the power of sitcoms.  On “Meet the Press,” in response to David Gregory’s question about gay marriage, Biden said that “this is evolving” and added:

And by the way, my measure, David, and I take a look at when things really begin to change, is when the social culture changes.  I think “Will and Grace” probably did more to educate the American public than almost anything anybody’s ever done so far.

“Will and Grace” ran for eight seasons, 1998-2006.  Its strongest years were 2001-2005, when it was the top rated show among the 18-49 crowd. Biden could point to General Social Survey (GSS) data on the gay marriage question.  In 1988, ten years before “Will and Grace,” the GSS asked about gay marriage.  Only 12% supported it, 73% opposed it.  The question was asked again in 2004, six years into the W+G era.  Support had more than doubled, and it continued to rise in subsequent years.

We don’t know just when in that 18-year period, 1988-2004, things “really began to change.”  Fortunately, the GSS more regularly asked the respondent’s view on sexual relations between same-sex partners.  Here too, tolerance grows in the “Will and Grace” period (gray on the graph):

The graph is misleading, though. To see the error, all we need do is extend our sampling back a few years  Here is the same graph starting in 1973:

The GSS shows attitudes about homosexuality starting to change in 1990.  By the time of the first episode of “Will and Grace,” the proportion seeing nothing wrong with homosexuality had already doubled.  Like Quayle’s “Murphy Brown” effect, the “Will and Grace” effect is hard to see.

The flaw in the Quayle-Biden method is not in mistaking TV for reality.  It’s in assuming that the public’s awareness is simultaneous with their own.

Why do our vice-presidents (and many other people) give so much credit (or blame) to a popular TV show for a change in public opinion?  The error is partly a simplistic post hoc logic.   “Will and Grace” gave us TV’s first gay principle character; homosexuality became more acceptable.  Murphy Brown was TV’s first happily unwed mother, and in the following years, single motherhood increased.   Besides, we know that these shows are watched by millions of people each week.  So it must be the show that is causing the change.

It’s also possible that our vice-presidents (and many other people) may also have been projecting their own experiences onto the general public.  Maybe Murphy Brown was the first or only unwed mother that Dan Quayle really knew – or at least she was the one he knew best.  It’s possible that Joe Biden wasn’t familiar with any gay men, not in the way we feel we know TV characters.  A straight guy might have some gay acquaintances or co-workers, but it’s the fictional Will Truman whose private life he could see, if only for a half hour every week.

Does TV matter?  When we think about our own decisions, we are much more likely to focus on our experiences and on the pulls and pushes of family, work, and friends.  We generally don’t attribute much causal weight to the sitcoms we watch.  Why then are we so quick to see these shows as having a profound influence on other people’s behavior, especially behavior we don’t like?   Maybe because it’s such an easy game to play.  Is there more unwed motherhood?  Must be “Murphy Brown.”  Did obesity increase in the 1990s?  “Roseanne.”  Are twentysomethings and older delaying marriage?  “Seinfeld” and “Friends.” And of course “The Simpsons,” or at least Bart and Homer, who can be held responsible for a variety of social ills.

Cross-posted at Montclair SocioBlog.

I’m not sure what effect prime-time sitcoms have on the general public.  Very little, I suspect, but I don’t know the literature on the topic.  Still, it’s surprising how many people with a similar lack of knowledge assume that the effect is large and usually for the worse.

Isabel Sawhill, is a serious researcher at Brookings; her areas are poverty and inequality.  Now, in a Washington Post article, she, says that Dan Quayle was right about Murphy Brown.

Some quick history for those who were out of the room — or hadn’t yet entered the room: In 1992, Dan Quayle was vice-president under Bush I.  Murphy Brown was the title character on a popular sitcom then in its fourth season — a divorced TV news anchor played by Candice Bergen.  On the show, she got pregnant.  When the father, her ex, refused to remarry her, she decided to have the baby and raise it on her own.

Dan Quayle, in his second most famous moment,* gave a campaign speech about family values that included this:

Bearing babies irresponsibly is simply wrong… Failing to support children one has fathered is wrong… It doesn’t help matters when prime-time TV has Murphy Brown, a character who supposedly epitomizes today’s intelligent, highly paid professional woman, mocking the importance of fathers by bearing a child alone and calling it just another lifestyle choice.

Sawhill, citing her own research and that of others, argues that Quayle was right about families:  children raised by married parents are better off in many ways — health, education, income, and other measures of well-being — than are children raised by unmarried parents whether single or together.**

But Sawhill also says that Quayle was right about the more famous part of the statement – that “Murphy Brown” was partly to blame for the rise in nonmarried parenthood.

Dan Quayle was right. Unless the media, parents and other influential leaders celebrate marriage as the best environment for raising children, the new trend — bringing up baby alone — may be irreversible.

Sawhill, following Quayle, gives pride of place to the media.  But unfortunately, she cites no evidence on the effects of sitcoms or the media in general on unwed parenthood.  I did, however, find a graph of trends in unwed motherhood. It shows the percent of all babies that were born to unmarried mothers.  I have added a vertical line to indicate the Murphy Brown moment.

The “Murphy Brown” effect is, at the very least, hard to detect. The rise is general across all racial groups, including those who were probably not watching a sitcom whose characters were all white and well-off.  Also, the trend begins well before “Murphy Brown” ever saw the light of prime time.  So 1992, with Murphy Brown’s fateful decision, was no more a turning point than was 1986, for example, a year when the two top TV shows were “The Cosby Show” and “Family Ties,” sitcoms with a very low rate of single parenthood and, at least for “Cosby,” a more inclusive demographic.

————————

  * Quayle’s most remembered moment: when a schoolboy wrote “potato” on the blackboard, Quayle “corrected” him by getting him to add a final “e” – “potatoe.”  “There you go,” said the vice-president of the United States approvingly. (A 15-second video is here.)

** These results are not surprising.  Compared with other wealthy countries, the US does less to support poor children and families or to ease the deleterious effects on children who have been so foolhardy as to choose poor, unmarried parents.