In Lies Across America: What Our Historic Sites Get Wrong, James Loewen looks at monuments, highway markers, historic museums, and other physical sites that commemorate elements of U.S. history. Loewen argues that the information that is included or ignored, and the language used to describe the people or events such sites are dedicated to, often distort or even actively rewrite history, reaffirming or justifying current beliefs in the process.
Sometimes these distortions are amusing. As we’ve posted about before, the sculptor of a statue of Civil War general John H. Morgan sitting on his favorite horse, Bess, added testicles to her because he felt that a female horse just wasn’t a sufficiently heroic mount, though she carried Morgan safely through the war well enough. In other cases, museums and monuments actively obscure the extent of racial oppression or largely ignore the voices of non-Whites. For instance, Almo, Idaho, features a monument to 295 immigrants who supposedly “lost their lives in a most horrible Indian massacre” in 1861 (p. 89). Loewen points out that this event was likely entirely invented, but fit discourses about savage Indians who simply could not live peacefully alongside vulnerable, civilized Whites that were still quite resonant when the monument was erected in 1938.
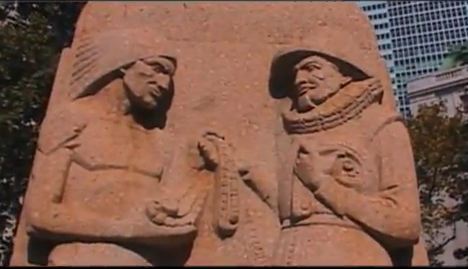
The documentary Monumental Myths takes a close look at some sites of this type It features Loewen, Howard Zinn, and others discussing the stories our historical monuments tell us and the consequences of the often very distorted narratives they construct about U.S. history:
Also check out our post on whose history monuments tell.