health/medicine

tumblr_kpgy8xxhuW1qz7ng1o1_500-1

In the Bible (book of Genesis), God sends two angels to the cities of Sodom and Gomorrah. These angels were charged with the task of evaluating the rate of sin within the walls. If the people were completely overridden by sin, God would destroy them.

What if those angels were statisticians, with access to GIS and geomapping software? How would the story have been different?

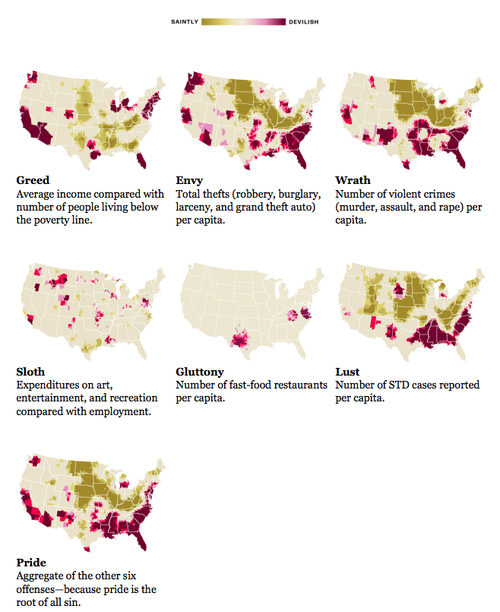
Some geographers at Kansas State University recently did an analysis of the spacial distribution of EVIL in the United States. Which part of the country is most afflicted by sloth? Lust? Greed? Envy? Wrath? Gluttony? Pride?

That’s right, folks – these geographers have operationalized sin, quantified it, then measured and mapped it. Pride is the aggregate distribution of all other sins, since it is supposedly the root of all evil (though one could also make a good case for apathy). Here’s how the sins are measured (and here’s a good view of the maps):

  • Greed: Average incomes versus total inhabitants below the poverty line
  • Envy: Total number of thefts (robbery, burglary, larceny, and stolen cars)
  • Wrath: Total number of violent crimes (murder, assault and rape) per capita
  • Lust: Sexually transmitted diseases per capita
  • Gluttony: Number of fast-foot restaurants per capita
  • Sloth: Expenditures on arts, entertainment and recreation versus rate of employment
  • Pride: An aggregate of the six other sins

By looking at sin at the aggregate level, what they’re doing here is examining sin as a social fact, as opposed to an individual trait. This would be a good extension of a lesson on Durkheim and suicide as a social fact. This study really shows why we really can’t truly measure concepts such as this across space and time, since the meaning of these individual acts will vary. Are the same acts categorized and labeled as rape in Montana as they are in New York? How violent does a person need to be before they are arrested for assault, and does that differ by region? Are we really measuring rates of STDs, or rates at which people get treatment for them? If my measure of gluttony is different than yours, can I apply my measure to your actions and call you gluttonous? Or should I be using your measures to evaluate your actions? Is this aggregate data showing different rates of sin, or is it just an effect of different meanings attached to the concepts?

This would also be useful in showing how we can’t extrapolate individual characteristics from aggregate data. For example, I live in Indiana (but teach in Kentucky). This region is low in envy, lust, wrath, and pride; average in gluttony, sloth, and greed; and not particularly high in any of the sins. Apparently I live in one of the more virtuous parts of the country.

I guess I can cancel that fire and brimstone insurance.

But does this aggregate data also indicate that I, Anomie, have greater odds of being virtuous? NO. The fact that I am virtuous in every way is merely a coincidence. You see, their data is not measuring individual sinful behavior. Rather, it’s measuring social facts, and structural conditions, that they hypothesize to be correlated with individual sinful behavior (but I take issue with some of the measures). For example:

  • I don’t have any STDS. CLEARLY I am not lustful. CLEARLY.
  • If you have more fast food restaurants within a five mile radius of your house than I do, are you more gluttonous than me? No. But at the aggregate level, this may be a good quick and dirty device. At least they didn’t use obesity rates as their measure.
  • And if I make $100k (one can dream) in Indiana, then move elsewhere to a job with the same salary, does that mean my greediness has changed along with my place of residence?

Now, excuse me while I get back to my slothful appreciation of art.

——————————

Angie Andriot, also known as Wicked Anomie, maintains the (mostly) sociology blog Wicked Anomie: Sociology Run Amok. On occasion, she likes to toss off her cape, hop offline, and play the role of Angie Andriot: Grad Student Extraordinaire – deftly juggling the writing of her dazzling dissertation at Purdue University with the imparting of wisdom to her lovely students at University of Louisville. She is particularly fond of symbolic interactionism. And cheese.

If you would like to write a post for Sociological Images, please see our Guidelines for Guest Bloggers.

This Associated Press interactive graphic (via) displays the number of uninsured by state and provides state-specific details on the rise of health insurance costs (for employers and employees) for each state.  The number of uninsured (darker = larger #s; note that this data is highly tied to the number of residents in each state):

Capture

Some data for Illinois:

Capture2

To interpret:  In Illinois, the amount of money an employer pays each year, on average, for a family has increased 65.3% over the last ten years, and the amount the employee pays has increased 88.4%.  Employees with families now spend, on average, $2,743 a year for their health insurance.  That translates into 7% of the family income (assuming a single breadwinner), up from 4% in 1996.  Over a million workers in Illinois are not so lucky; they have no health insurance at all.

This data reminds us that, in addition to many uninsured, many of us are already paying for health insurance, so the use of taxes to pay for government provided health care would not necessarily cost those who are already insured and may actually save them money.

—————————

Lisa Wade is a professor of sociology at Occidental College. You can follow her on Twitter and Facebook.

Using maternal mortality, Hans Rosling illustrates the uncertainty in different ways of measuring variables:

Found at GapMinder.

—————————

Lisa Wade is a professor of sociology at Occidental College. You can follow her on Twitter and Facebook.

The vintage ads from The Art of Manliness, submitted by Dmitrity T.M., reveal that we have been trying to use technology to change our appearance for quite some time.  Cosmetic surgeries are a brave new world of personal body modification, but they do not represent a break from the past, so much as a historical trajectory.

hat

fat_men1

lrg_man_can_come_back

lrg_better_nose

—————————

Lisa Wade is a professor of sociology at Occidental College. You can follow her on Twitter and Facebook.

In a list of 15 contrasting billboards on Buzzfeed, I found these three:

Picture1Picture2Picture3

I usually think of public service announcements as a form of education.  Presumably there’s a harmful ignorance out there somewhere that can be corrected.  But these contrasts bring into stark relief the fact that public service announcements aren’t only fighting ignorance, they’re fighting corporations.  The battle isn’t just between misinformation and information, it’s between for-profit and non-profit organizations.

—————————

Lisa Wade is a professor of sociology at Occidental College. You can follow her on Twitter and Facebook.

U.S. tobacco companies–through political donations, lobbying efforts, and networks–are able to exert some control over the degree to which, and how, the U.S. government controls its industry.  One area of resistance involves warning labels.  The tobacco company has been resisting the very idea that cigarettes cause cancer, and the advertising of this fact, for decades.

This photo of cigarettes on sale at a duty free shop in Düsseldorf, Germany, sent in by Steve W., gives us some perspective on just how successful they’ve been:

CIMG4252

Here, for comparison, is a photo of cartons of Marlboro’s on sale in Texas:

doc49fd157246239836939343

In case you can’t read it, the large text above the “Marlboro” logo reads: “Flip Top Box.”

—————————

Lisa Wade is a professor of sociology at Occidental College. You can follow her on Twitter and Facebook.

The figure below, borrowed from Matthew Yglesias, shows that poor children, especially poor black children, have higher concentration of lead in the blood than other middle class children.

reproductive_roulette-26

Lead poisoning is a serious problem, causing cognitive delay, hyperactivity, and antisocial behavior. If poor children do less well in school and on standardized tests, it may be, in part, because of the environmental toxins to which they are disproportionately exposed.

See also a previous post in which I argue that lead poisoning remained a mother’s problem until the China toy scandal put middle class children at risk, at which point the state stepped in to ensure children’s safety.

Also see this post on race and toxic release facilities.

—————————

Lisa Wade is a professor of sociology at Occidental College. You can follow her on Twitter and Facebook.

Ideal bodies vary across cultures and time.   In the U.S. today, childhood obesity is considered a significant social problem and is widely covered in the news, on talk shows, and the like.  When food was more scarce, however, having a fat child was a sign of health and well-being.  This ad, from 1898, is for a tonic that will fatten up your child.  How times change.

0_28f63_d77c6eef_XL

—————————

Lisa Wade is a professor of sociology at Occidental College. You can follow her on Twitter and Facebook.