[Note: A couple of readers have sent in info that calls into question the graphic below — not the relative sizes and such, but the specific numbers cited for the size of various spills (making them look larger than other reports). This may be a reflection of how the organization defines “spilled” oil (they say “lost to the environment”), and I provide their definition below. Thanks to T for providing a list of generally accepted estimates of major spills. Given that the organization providing the data is an association of oil tanker owners, it seems unlikely that they would be intentionally exaggerating the sizes of spills for political purposes or something. So while the graphic’s illustration of the relative size of these spills is still accurate in a general sense, unless I can track down a clear explanation for the cited numbers, I wouldn’t rely on them. Sorry for the confusion, and I’ll continue updating if I can figure out what’s going on.]
———-
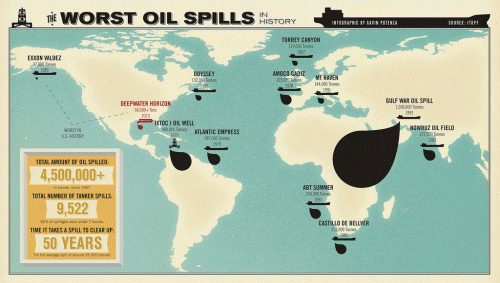
Allie B. sent in a graphic comparing the BP leak to major tanker oil spills (and I forgot to add the numbers reported are in tonnes, which is about 2,240 pounds each):
The info is based on data from The International Tanker Owners Pollution Federation Limited, an industry group that provides a lot of data on spills from oil tankers (so that doesn’t include leaks or spills from pipelines, wells, and so on). From the website:
It should be noted that the figures for the amount of oil spilt in an incident include all oil lost to the environment, including that which burnt or remained in a sunken vessel. There is considerable annual variation in both the incidence of oil spills and the amounts of oil lost. Consequently, the figures in the following tables, and any averages derived from them should be viewed with caution.
UPDATE: Commenter T points out that some of the numbers here (especially the Gulf War spill) don’t match up with more widely-reported data and seem to exaggerate the size of some of the spills. The relative sizes still hold up in general, but be cautious with the actual reported sizes of the spills. It may be that their way of defining spills (all oil “lost to the environment”) includes significantly more oil than what is traditionally counted as being part of a spill. I’m trying to track down exactly what’s going on here.
Given how much media coverage BP leak is getting, it’s a bit shocking to see it in comparison to the tanker spills represented here. That isn’t to say that somehow by comparison the BP leak isn’t that bad; rather, it made me aware of how little I usually hear about the environmental impacts of the global petroleum industry as long as they don’t happen along the U.S. coastline.
For instance, a recent NYT article discusses the impacts of oil leaks and spills in Nigeria:
The Niger Delta…has endured the equivalent of the Exxon Valdez spill every year for 50 years by some estimates. The oil pours out nearly every week, and some swamps are long since lifeless…leaving residents here astonished at the nonstop attention paid to the gusher half a world away in the Gulf of Mexico. It was only a few weeks ago, they say, that a burst pipe belonging to Royal Dutch Shell in the mangroves was finally shut after flowing for two months…
I think the illustration brings into perspective how our perceptions of environmental disasters are shaped (not surprisingly, I know) by the amount of media coverage it gets and whether it occurs in a place we’re familiar with. Some pollution gets national and international media attention (at least for a while), and some is largely ignored outside the local area directly affected. The BP leak is by no means the largest oil-related ecological disaster in history — not even close yet, and hopefully it won’t get there — but media coverage and clean-up efforts aren’t distributed equally. And, again, I’m not saying that somehow this means we shouldn’t be too concerned about the Gulf leak. But it does make clear that we’re not equally concerned about, say, all people whose livelihoods are devastated by petroleum leaks/spills in waterways.
And just out of curiosity about the link between U.S. oil consumption and Nigerian oil production, I went to the webpage of the U.S. Energy Information Administration to see how much oil the U.S. imports from Nigeria. It’s currently our 4th-largest source of crude imports, and our daily Nigerian imports are up quite a bit over a year ago (about 1.1 million barrels in April ’10 compared to 673,000 a day in April ’09):
And I’m a bit embarrassed to admit that I had no idea Canada is currently our biggest source of imported crude oil (and total petroleum imports as well).
Gwen Sharp is an associate professor of sociology at Nevada State College. You can follow her on Twitter at @gwensharpnv.

