Princeton sociology professor Viviana Zelizer wrote a wonderful succinct editorial for the New York Times about the idea of giving money as a gift. Money, she explains, is used in the most impersonal of transactions (even antagonistic ones, as someone who recently paid a parking ticket recalls), so giving money to loved ones can be seen as crass, tasteless, or thoughtless.
Zelizer explains that cultural elites have been worrying about this since the early 1900s. The solution: “camouflage money inside a traditional gift.” Offering some examples, Zelizer writes:
In the December 1909 Ladies’ Home Journal, for instance, the writer Lou Eleanor Colby said she had found a way to “disguise the money so that it would not seem just like a commercial transaction.” She explained how she had incorporated $10 for her mother into artwork. She inserted dollar bills into two posters; one showed five sad bills not knowing where to go, and the other depicted the happy ending: “five little dollars speeding joyfully” toward her mother’s purse.
Housewives hid gold coins in cookies and boxes of candies; dollar bills could decorate belt-buckles or picture frames. Women boasted when the recipient failed to realize that the actual present was money. Men also disguised the money they gave to their wives as gifts, to distinguish it from their allowances. If you give her a check, The Ladies’ Home Journal advised, “put it in an embroidered purse, or a leather sewing basket or a jewel box which will be a little gift in itself.” The better the disguise, the more successful the gift.
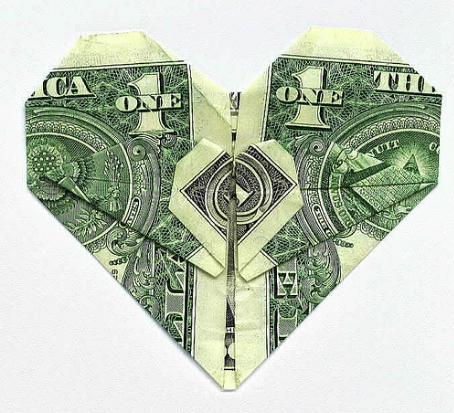
Today these tokens are probably familiar to many of you. One site suggests making the money into a gift basket. Another suggests that you give the gift of (money) origami.
Soon, Zelizer explains, companies figured out how to cash in on this cashing out, inventing the idea of decorated money orders and telegrams:
…in 1910, American Express began advertising money orders as an “acceptable Christmas gift.” Western Union improved on the idea by creating distinctive telegrams for sending money for special occasions, while greeting card companies started selling decorative money holders for birthdays and holidays.
Thus the “money holder” card and the “gift card” was born.
While it may seem obvious to many of us now that gift certificates and money holders exist, Zelizer shows that these objects have a cultural history, devised to solve a particular problem that emerged with the spread of a wage-based economy.
Via Kieran at OrgTheory; photo by Chris Palmer flickr creative commons. Originally posted in 2010.
Lisa Wade, PhD is an Associate Professor at Tulane University. She is the author of American Hookup, a book about college sexual culture; a textbook about gender; and a forthcoming introductory text: Terrible Magnificent Sociology. You can follow her on Twitter and Instagram.