We all know that, on some basic level, money is purely symbolic. It only works because everyone collectively agrees to participate in the fantasy that a dollar bill is worth a dollar, whatever that is. Moreover, most of our money these days is purely electronic, represented by ones and zeros and real only in the most abstract sense possible.
Christopher Ingraham at the Washington Post offered another way of thinking about money as a social construction: how much it costs to make it. None of our coins are actually worth what they cost, and pennies and nickels are worth quite a bit less.
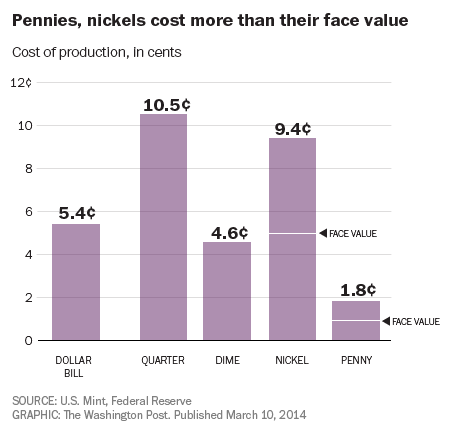
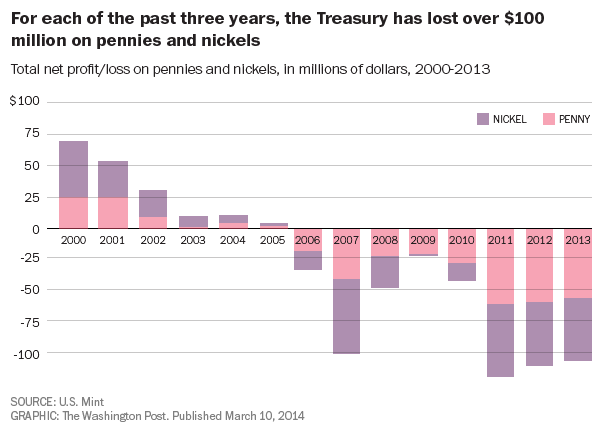
The excess cost of producing pennies and nickels means a budget deficit for the Treasury. In 2013, producing the coins cost the government $105 million dollars above and beyond the coins’ value.
Interestingly, moves to eliminate pennies have been successfully opposed by the zinc industry for years, illustrating another sociological phenomenon: the power of corporations to shape government decisions.
Lisa Wade, PhD is an Associate Professor at Tulane University. She is the author of American Hookup, a book about college sexual culture; a textbook about gender; and a forthcoming introductory text: Terrible Magnificent Sociology. You can follow her on Twitter and Instagram.