politics: democracy

I love gender and sexual demography.  It’s incredibly important work.  Understanding the size and movements of gender and sexual minority populations can help assess what kinds of resources different groups might require and where those resources would be best spent, among others things.  Gary J. Gates and Frank Newport initially published results from a then-new Gallup question on gender/sexual identity in 2012-2013 (here).  At the time, 3.4% of Americans identified as either lesbian, gay, bisexual, or transgender.  It’s a big deal – particularly as “identity” is likely a conservative measure when it comes to assessing the size of the population of LGBT persons.  After I read the report, I was critical of one element of the reporting: Gates and Newport reported proportions of LGBT persons by state.  As data visualizations go, I felt the decision concealed more than it revealed.

From 2015-2016, Gallup collected a second round of data. These new data allowed Gates to make some really amazing observations about shifts in the proportion of the U.S. population identifying themselves as LGBT.  It’s a population that is, quite literally on the move.  I posted on this latter report here.  The shifts are astonishing – particularly given the short period of time between waves of data collection.  But, again, data on where LGBT people are living was reported by state.  I suspect that much of this has to do with sample size or perhaps an inability to tie respondents to counties or anything beyond state and time zone.  But, I still think displaying the information in this way is misleading.  Here’s the map Gallup produced associated with the most recent report:
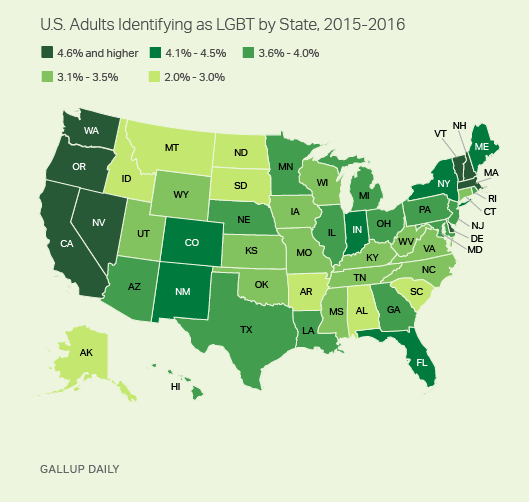
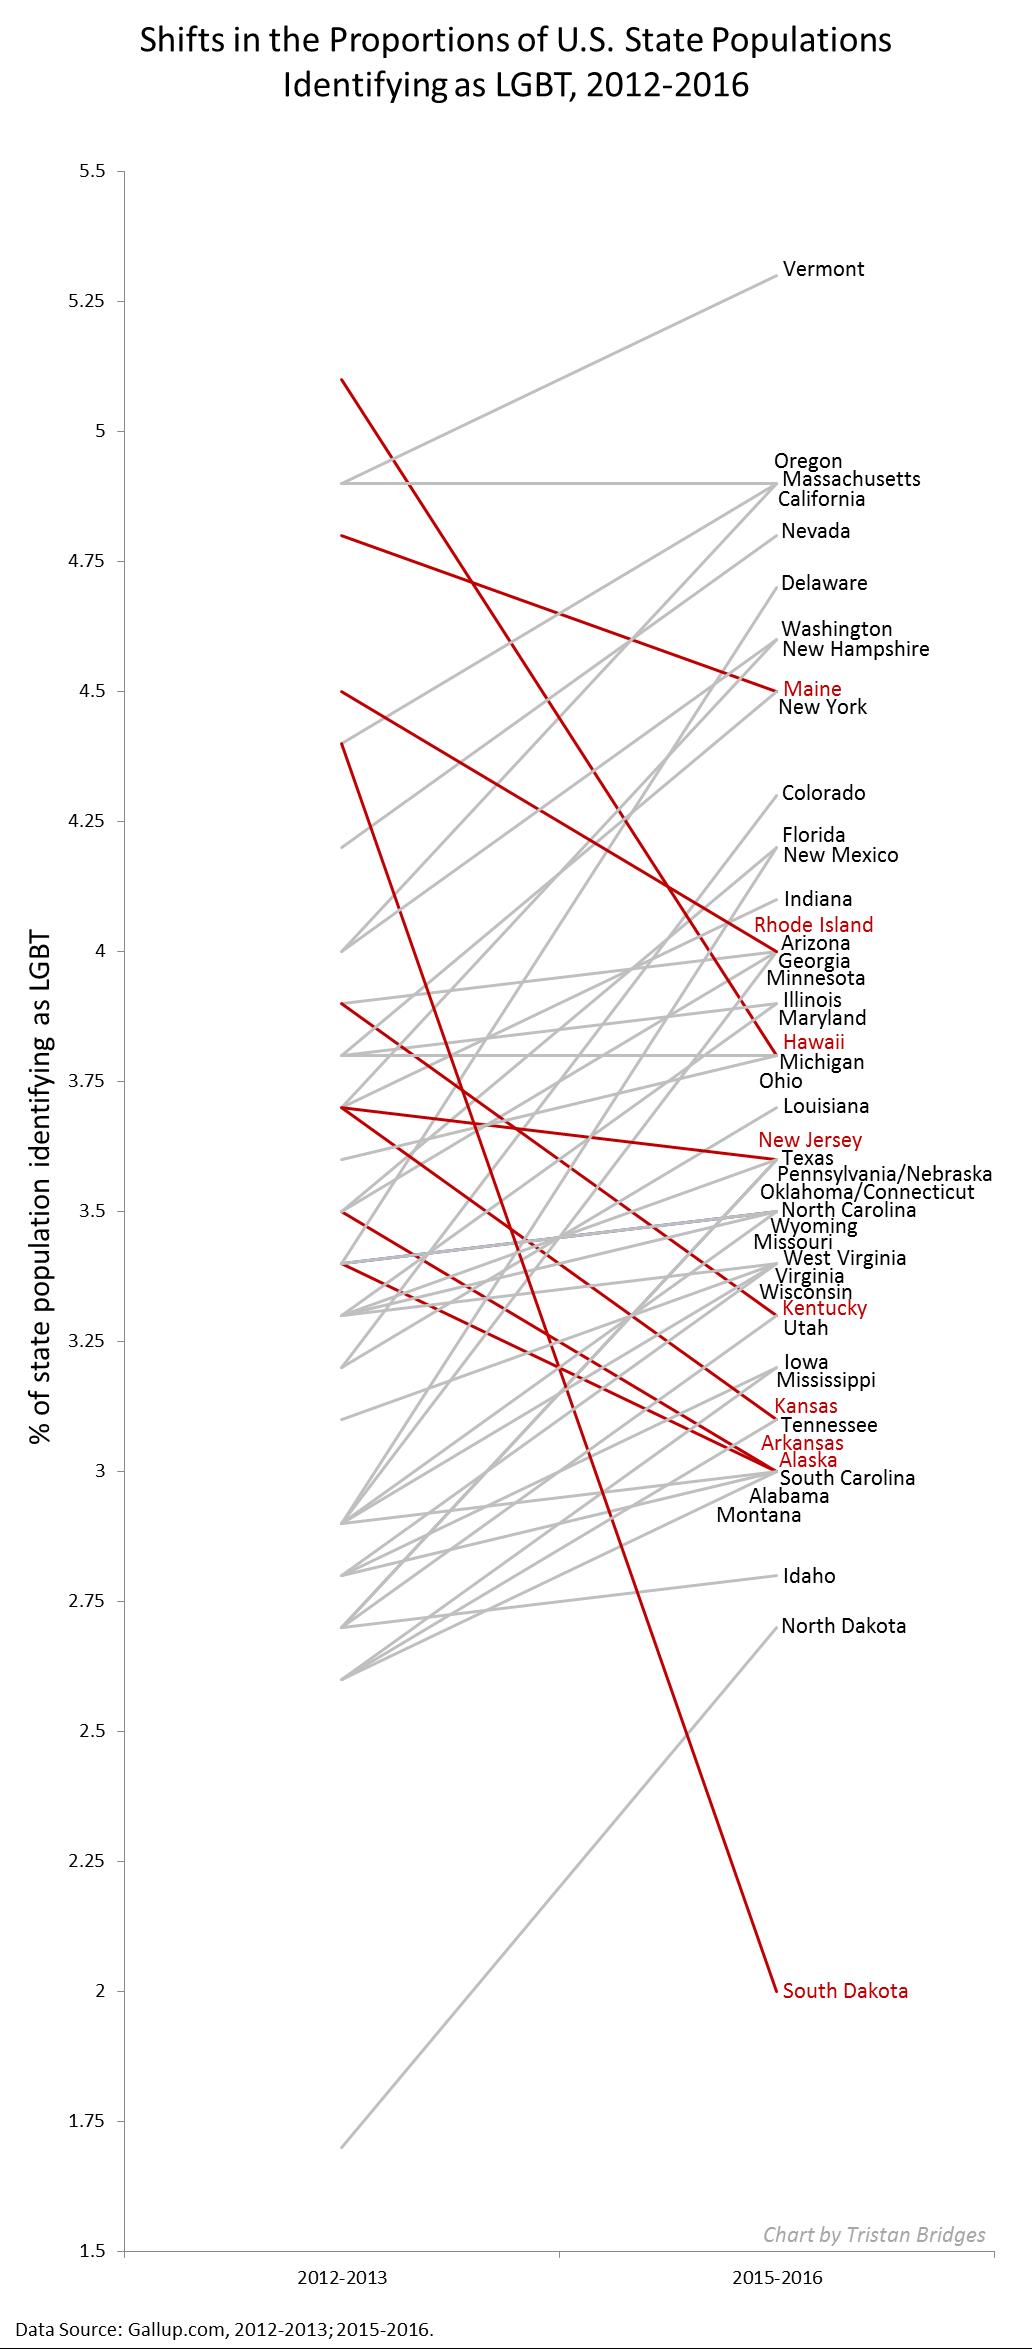
During the 2012-2013 data collection, Hawaii led U.S. states with the highest proportions of LGBT identifying persons (with 5.1% identifying as LGBT)–if we exclude Washington D.C. (with 10% identifying as LGBT).  By 2016, Vermont led U.S. states with 5.3%; Hawaii dropped to 3.8%.  Regardless of state rank, however, in both reports, the states are all neatly arranged with small incremental increases in the proportions of LGBT identifying persons, with one anomaly–Washington D.C.  Of course, D.C. is not an anomaly; it’s just not a state. And comparing Washington D.C. with other states is about as meaningful as examining crime rate by European nation and including Vatican City.  In both examples, one of these things is not like the others in a meaningful sense.

In my initial post, I suggested that the data would be much more meaningfully displayed in a different way.  The reason D.C. is an outlier is that a good deal of research suggests that gender and sexual minorities are more populous in cities; they’re more likely to live in urban areas.  Look at the 2015-2016 state-level data on proportion of LGBT people by the percentage of the state population living in urban areas (using 2010 Census data).  The color coding reflects Census regions (click to enlarge).
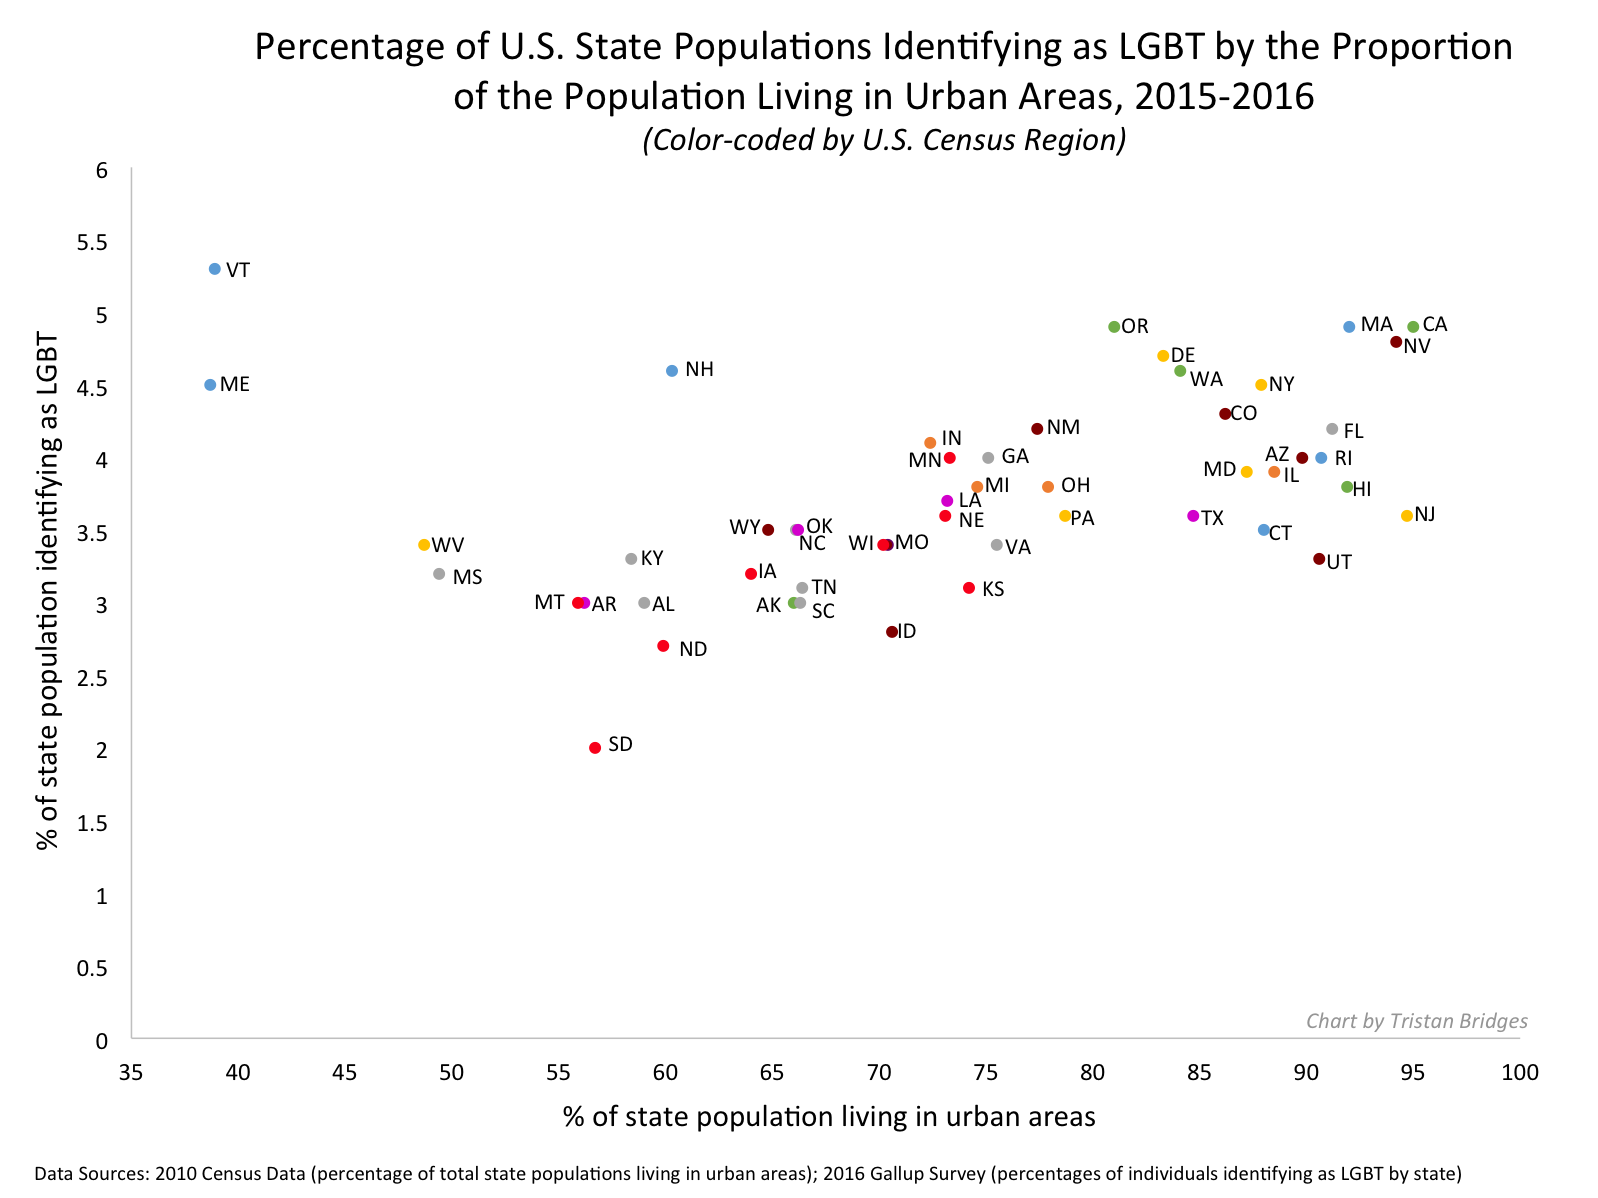
Vermont is still a state worth mentioning in the report as it bucks the trend in an impressive way (as do Maine and New Hampshire).  But I’d bet you a pint of Cherry Garcia and a Magic Hat #9 that this has more to do with Burlington than with thriving communities of LGBT folks in the towns like Middlesex, Maidstone, or Sutton.

I recognize that the survey might not have a sufficient sample to enable them to say anything more specific (the 2015-2016 sample is just shy of 500,000).  But, sometimes data visualizations obscure more than they reveal.  And this feels like a case of that to me.  In my initial post, I compared using state-level data here with maps of the U.S. after a presidential election.  While the maps clearly delineate which candidate walked away with the electoral votes, they tell us nothing of the how close it was in each state, nor do they provide information about whether all parts of the state voted for the same candidates or were regionally divided.  In most recent elections traditional electoral maps might leave you wondering how a Democrat ever gets elected with the sea of red blanketing much of the nation’s interior.  But, if you’ve ever seen a map showing you data by county, you realize there’s a lot of blue in that red as well–those are the cities, the urban areas of the nation.  Look at the results of the 2016 election by county (produced by physicist Mark Newman – here).  On the left, you see county level voting data, rather that simply seeing whether a state “went red” or “went blue.”  On the right, Newman uses a cartogram to alter the size of each county relative to its population density.  It paints a bit of a different picture, and to some, it probably makes that state-level data seem a whole lot less meaningful.
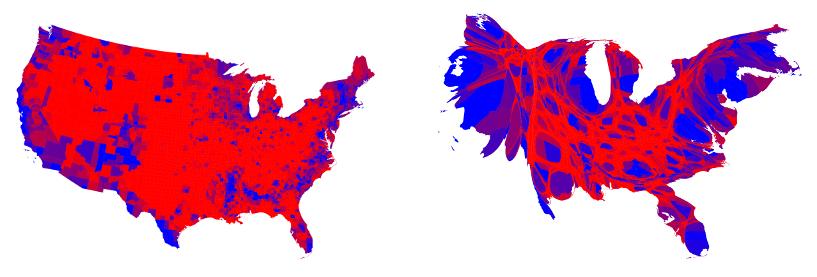
Maps from Mark Newman’s website: http://www-personal.umich.edu/~mejn/election/2016/

The more recent report also uses that state-level data to examine shifts in LGBT identification within Census regions as well.  Perhaps not surprisingly, there are more people identifying as LGBT everywhere in the U.S. today than there were 5 years ago (at least when we ask them on surveys).  But rates of identification are growing faster in some regions (like the Pacific, Middle Atlantic, and West Central) than others (like New England).  Gates suggests that while this might cause some to suggest that LGBT people are migrating to different regions, data don’t suggest that LGBT people are necessarily doing that at higher rates than other groups.
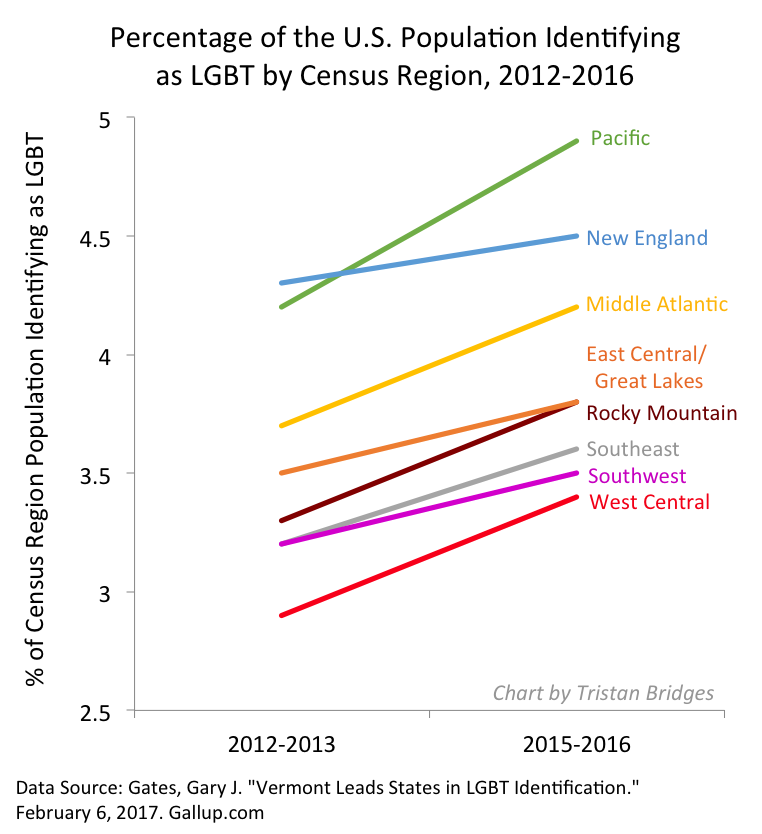
The recent shifts are largely produced by young people, Millennials in the Gallup sample.  And those shifts are more pronounced in those same states most likely to go blue in elections.  As Gates put it, “State-level rankings by the portion of adults identifying as LGBT clearly relate to the regional differences in LGBT social acceptance, which tend to be higher in the East and West and lower in the South and Midwest. Nevada is the only state in the top 10 that doesn’t have a coastal border. States ranked in the bottom 10 are dominated by those in the Midwest and South” (here).

When we compare waves of data collection, we can see lots of shifts in the LGBT-identifying population by state (see below; click to enlarge).  While the general trend was for states to have increasing proportions of people claiming LGBT identities in 2015-2016, a collection of states do not follow that trend.  And this struck me as an issue that ought to provoke some level of concern.  Look at Hawaii, Rhode Island, and South Dakota, for example.  These are among the biggest shifts among any of the states and they are all against the liberalizing trend Gates describes.
Presentation of data is important.  And while the report might help you realize, if you’re LGBT, that you might enjoy living in Vermont or Hawaii more than Idaho or Alabama if living around others who share your gender or sexual identity is important to you, that’s a fact that probably wouldn’t surprise many.  I’d rather see maps illustrating proportions of LGBT persons by population density rather than by state.  I don’t think we’d be shocked by those results either.  But it seems like it would be provide a much better picture of the shifts documented by the report than state-level data allow.

Tristan Bridges, PhD is a professor at the University of California, Santa Barbara. He is the co-editor of Exploring Masculinities: Identity, Inequality, Inequality, and Change with C.J. Pascoe and studies gender and sexual identity and inequality. You can follow him on Twitter here. Tristan also blogs regularly at Inequality by (Interior) Design.

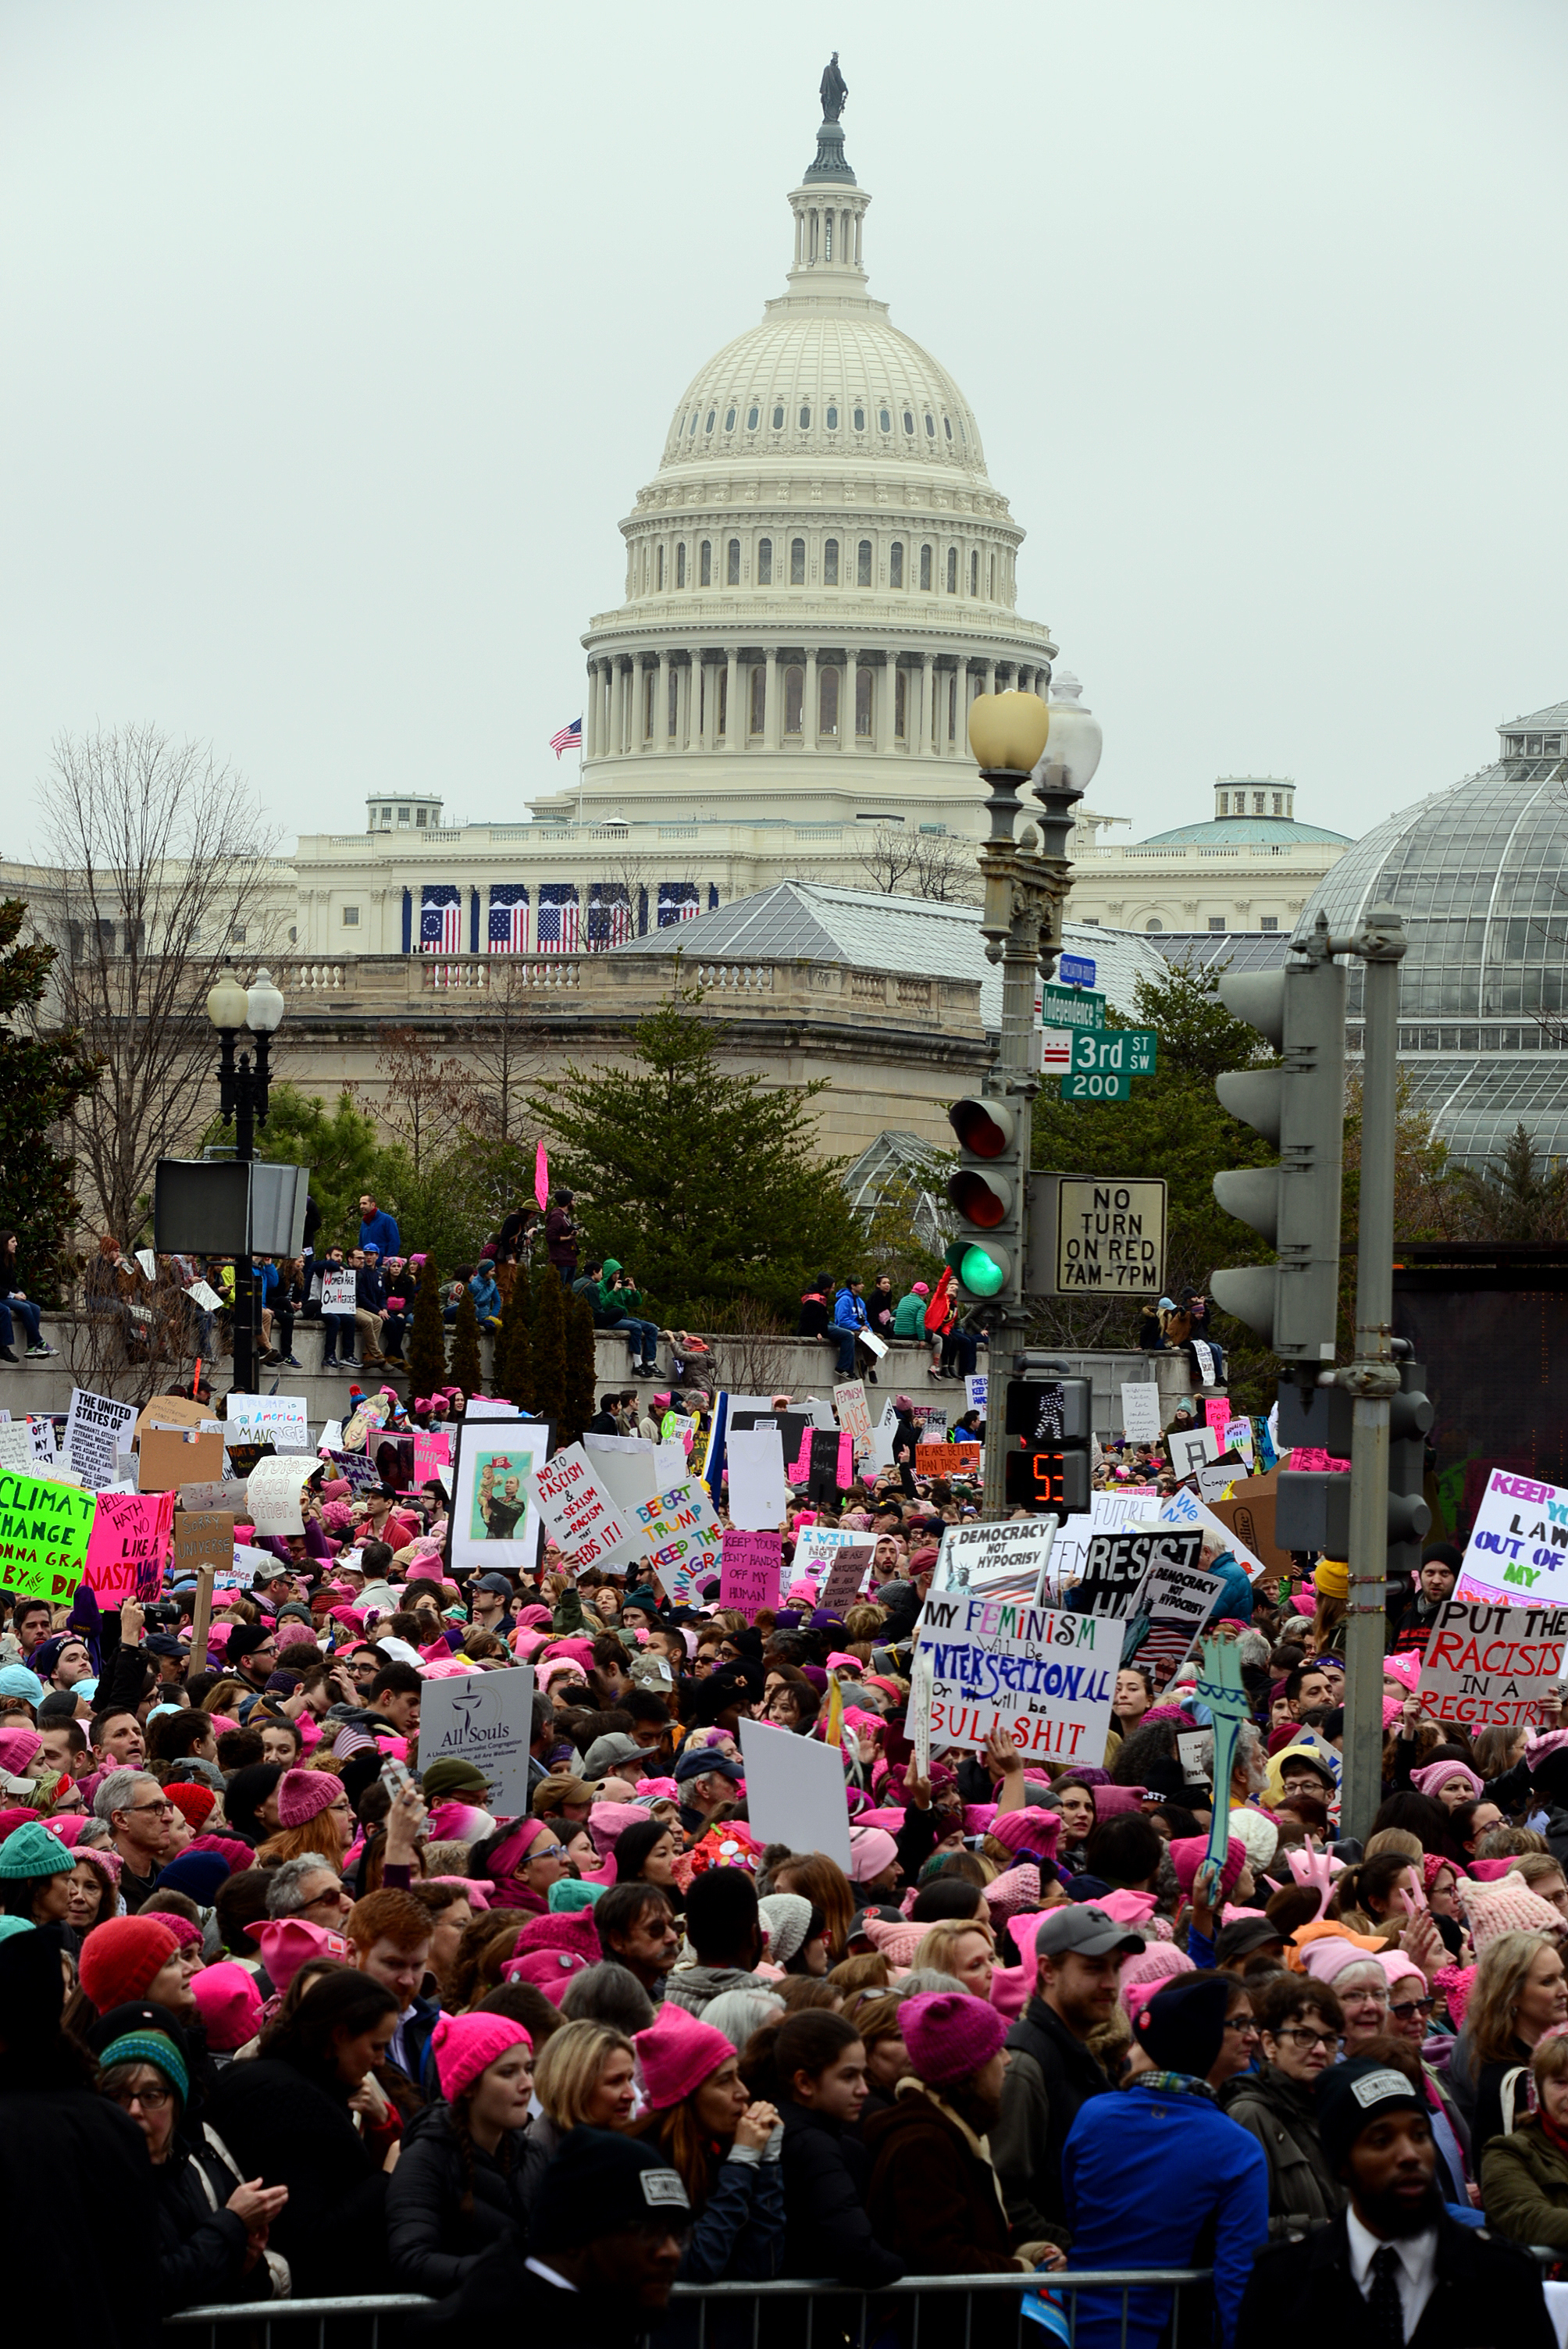
Protestors march in the Woman’s March on Washington D.C. Jan. 21, 2017. The Capital Mall area was the starting point of the march, hundreds of thousands of people attended. (National Guard photo by Tech. Sgt. Daniel Gagnon, JTF-DC).

Waves of pink knitted hats and protest signs packed the streets of D.C. on January 21, 2017, just one day after President Trump’s inauguration drew average crowds. The Women’s March of 2017 was the largest protest in recent history, bringing together over 500,000 people in DC- the location of the flagship march, and over 2.9 million people nationwide. Protesters came from near and far to protect a diverse set of rights that are threatened by the incoming administration. Perhaps the Women’s March can be understood as a partial response to President Obama’s declaration in his farewell address that the most important office in a democracy is “citizen,” and, thus, citizens must work to improve our society, not just when there is an election or when their own narrow interests are at stake. The march was an example of what this kind of democracy looks like. Originally proposed on social media, the idea for the march took off and a groundswell of support emerged from independent individuals and those associated with organizations.  Despite this level of support, many have speculated about who attended the march, whether they voted, the goals of protesters and their level of civic engagement. Some have discounted the protesters as only forwarding the perspectives and issues of white women and eschewing those of other groups such as people of color and/or members of the LGBTQ community.

Combatting this new era of “alternative facts,” a research team led by Dr. Dana R. Fisher, Dr. Dawn M. Dow and Dr. Rashawn Ray from the University of Maryland, College Park provides data-supported facts about participants at the Women’s March. Teams of 2 surveyed participants throughout the march (full details of sampling and methodology available upon request) to understand who was protesting and why. In total, 527 people completed the survey (representing a 92.5% response rate).

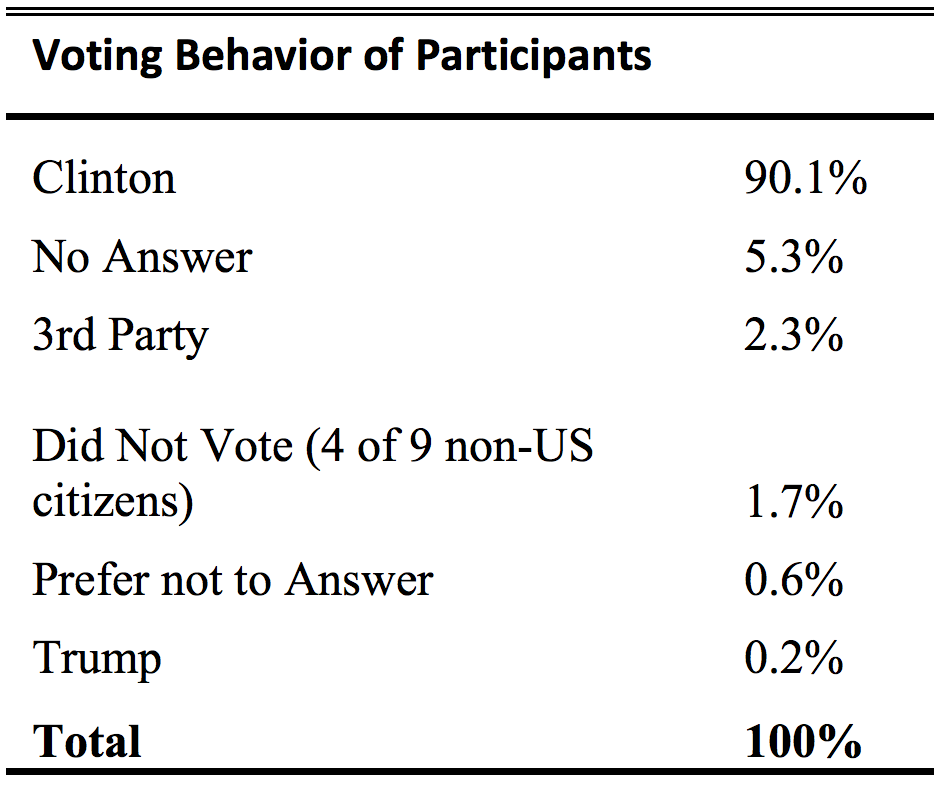
Far from using protesting as a substitute for voting, as a recent tweet from Trump suggested, initial findings from this project show that the protesters at the Women’s March voted, and overwhelmingly for Secretary Hillary Clinton. Among respondents, 90.1% reporting voting for Hilary Clinton, 2.3% voted for a third-party candidate and .2% (one person) voted for Donald Trump. Among the 1.7% who explicitly said they did not vote, nearly half were non-U.S. citizens who are not eligible to do so.

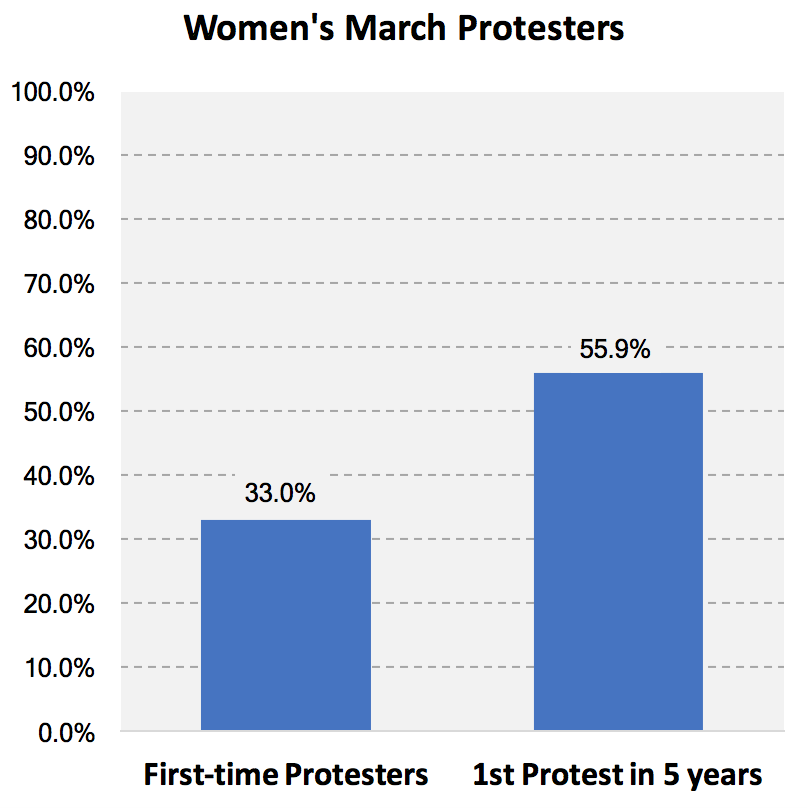
Our findings also suggest that the Women’s March has potentially lit the political fires of a new generation of activists and reactivated the political activism of others. Indeed, a third of the participants reported that the Women’s March was their first time participating in a protest ever. For over half of the participants (55.9%), the March was their first protest in 5 years (including those who had never participated before).

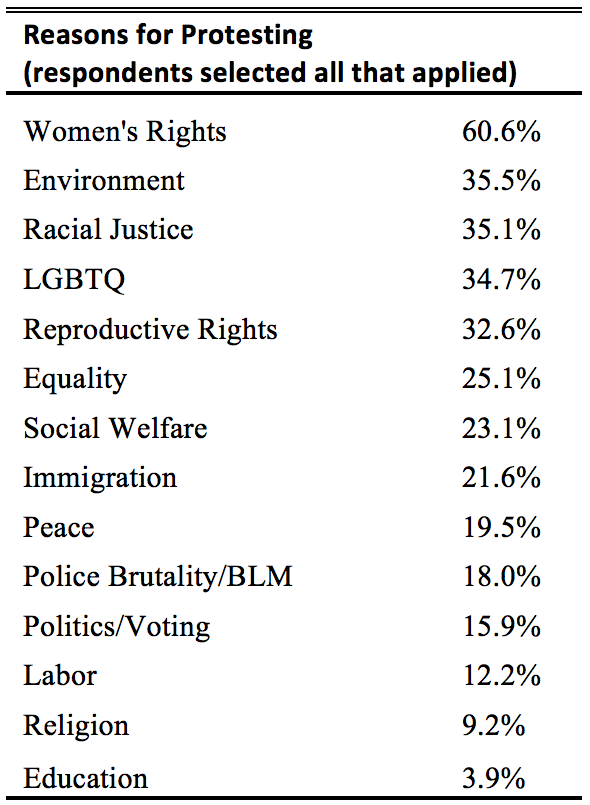
Respondents were also asked to identify the issues that motivated them to protest.  Our data suggest protesters were unified by a range of distinct and overlapping priorities. Given the name of the march, it is not surprising that 60.6% of respondents cited women’s rights as a motivation for protesting.  However, other social issues were also at the forefront of protesters’ minds. Nearly tied for second place, protesters cited the environment (35.5%), racial justice (35.1%), LGBTQ rights (34.7%), and reproductive rights (32.7%) as motivations to attend. Other political issues were also well represented including equality (25.1%), social welfare (23.1%) and immigration (21.6%).  Indeed, rather than representing a narrow set of interests, protesters identified multiple and diverse motivations for participating.

Historically protests focus on one social issue such as equal pay, climate change, voting rights or same sex marriage. The Women’s March was different in that its protesters were seemingly engaged in intersectional activism–a version of activism that is sensitive to how race, class, gender and sexuality complicate inequality. Perhaps the Women’s March is distinct in this way because protesters were not just motivated by concrete issues, but they were also motivated by a desire to protect and reassert a vision of America that embraces diversity and inclusion as a strength rather than a threat. This vision of America is increasingly under attack by the Trump Administration. It remains to be seen how the energy from the march will translate into change locally across the country but recent protests suggest that citizens stand ready to protect their rights and the rights of others.

Dr. Dawn M. Dow is an Assistant Professor of Sociology at the University of Maryland, College Park.  She received a PhD in sociology from the University of California, Berkeley and also earned a JD from Columbia University, School of Law.  Dow’s research examines intersections of race, class and gender within the context of the family, educational settings, the workplace and the law. Her work has been published in journals including Gender & Society, Journal of Marriage and Family and Sociology of Race & Ethnicity.  Follow her on Twitter here.

Dr. Dana R. Fisher is a Professor of Sociology and the Director of the Program for Society and the Environment at the University of Maryland. Her research focuses on environmental policy, civic participation and activism more broadly. She has written extensively on activism and social protest in articles as well as in her second book Activism, Inc. (Stanford University Press 2006).  Fisher’s work on protest builds on data collected from around 5,000 protesters at thirteen protest events in six countries. For more information, go to www.drfisher.umd.edu.  Follow her on Twitter here.

Dr. Rashawn Ray is an Associate Professor of Sociology at the University of Maryland, College Park. Ray obtained a Ph.D. in Sociology from Indiana University in 2010. From 2010-2012 he was a Robert Wood Johnson Foundation Health Policy Research Scholar at the University of California, Berkeley/UCSF. Ray’s research addresses the mechanisms that manufacture and maintain racial and social inequality. His work also speaks to ways that inequality may be attenuated through racial uplift activism and social policy. Follow him on Twitter here.


The Women’s March in Washington had three times more people in attendance than did President Trump’s inauguration. Many have argued about the reasons for these numbers (see here, here, and here), and used them both individually and together to make claims about activism and political support. But something is missing from these conversations. In order to fully understand the differences in attendance at these events in D.C., and to avoid taking these numbers to mean something they do not, we must account for class and race.

Gender, education and race may have been the biggest rifts in voters this past presidential election, but class is part of this political shift. At least part of why people didn’t show up for President Trump’s inauguration in droves but did show up to the Women’s Marches is a story of class privilege and the cultural capital that comes with it. Upper middle class white women and urban dwellers from all classes had easy access to Women’s Marches, both in D.C. and around the country. Many of Trump’s voters would have had to fly to D.C. Because research shows that only about 50% of the population in the US flies each year, and because that tracks with income and education, Women’s March supporters may have been more likely to fly than Trump voters were. If we look at data from just the five counties with the largest vote share for Trump, we see that, except for Buchanan, Virginia, these locations present great travel distance. Further, President Trump received 4.1% of the vote in Washington, D.C., and lost in surrounding states by large percentages. As CNN points out, a trip to inauguration would be a long one for a critical mass of Trump supporters.

White voters from rural areas and those without a college education represent the largest demographics to turn out for Trump. Many of Trump’s supporters reside in more rural areas that are struggling economically. Cost and familiarity with travel, ease and options in taking time off of work, and geographic proximity to D.C. may have affected participation in Inauguration events. Sociologists talk about cultural capital—or the non-financial goods that help with social mobility beyond economic means. Such capital can include knowledge, skills, and education—things that are both material and symbolic. When Emily lived in rural Arkansas, many people she met had never left the state or in some cases even the county. Indeed, when she told a friend there that she flew home for Christmas and it cost $70, he was surprised that a plane ticket cost less than it did to fill up his truck, because he’d never flown before. Emily’s knowledge of air travel is a form of cultural capital, and one that could put her at an advantage in planning a trip to fly to Washington, D.C. for the March. There is an intimidation that comes from not having done that or been there before—your cultural capital can determine how well versed you are in navigating AirBnB and the slew of cheap flight websites that exist.

Why was the Women’s March so highly attended? Many have analyzed the mass turn-out in D.C., nationally, and internationally. For the first time, the Women’s March brought out highly educated, more affluent white women who have the forms of capital to plan and attend a weekend in D.C. Of course, there were many—millions, in fact—who did not go to D.C., but who showed support in sister marches around the country and globe. For many, their lack of attendance in D.C. could be due to the same barriers that perhaps inhibited many from attending the Inauguration. For others, their participation was possible because demographics likely to participate in Women’s Marches – LGBTQA+ folks and people of color – are more likely to reside in urban communities. But to compare these attendance rates without talking about class, and without talking about the mobilization of white women, muddies the realities of who is ready and willing to act at more local levels.

While the Women’s March may have kicked off a movement that has the tools in place for success, we need to remember that Trump’s path to success was unpredicted. To take his inauguration attendance numbers to mean that his initial supporters have changed their minds or that Trump has lost political support would be a potentially grave mistake. To take what is now the largest protest in U.S. history as evidence of mass, continued mobilization, that may also be inaccurate. White women are just starting to show up—will they continue to do so? In talking about the intersections of class and race, we remember who is able to mobilize and show support when, and we must bring these intersections to the fore in future conversations about mobilization and activism.

Sarah Diefendorf is a PhD candidate in Sociology at the University of Washington. Her research centers on sexuality, gender, and evangelical religious groups. You can follow her on Twitter here.

Emily Kalah Gade is a PhD candidate in Political Science at the University of Washington. Her research centers on political violence, civil resistance and militancy.

1Will Davies, a politics professor and economic sociologist at Goldsmiths, University of London, summarized his thoughts on Brexit for the Political Economy and Research Centre, arguing that the split wasn’t one of left and right, young and old, racist or not racist, but center and the periphery. You can read it in full there, or scroll down for my summary.

——————————–

Many of the strongest advocates for Leave, many have noted, were actually among the beneficiaries of the UK’s relationship with the EU. Small towns and rural areas receive quite a bit of financial support. Those regions that voted for Leave in the greatest numbers, then, will also suffer some of the worst consequences of the Leave. What motivated to them to vote for a change that will in all likelihood make their lives worse?

Davies argues that the economic support they received from their relationship with the EU was paired with a culturally invisibility or active denigration by those in the center. Those in the periphery lived in a “shadow welfare state” alongside “a political culture which heaped scorn on dependency.”

Davies uses philosopher Nancy Fraser’s complementary ideas of recognition and redistribution: people need economic security (redistribution), but they need dignity, too (recognition). Malrecognition can be so psychically painful that even those who knew they would suffer economically may have been motivated to vote Leave. “Knowing that your business, farm, family or region is dependent on the beneficence of wealthy liberals,” writes Davies, “is unlikely to be a recipe for satisfaction.”

It was in this context that the political campaign for Leave penned the slogan: “Take back control.” In sociology we call this framing, a way of directing people to think about a situation not just as a problem, but a particular kind of problem. “Take back control” invokes the indignity of oppression. Davies explains:

It worked on every level between the macroeconomic and the psychoanalytic. Think of what it means on an individual level to rediscover control. To be a person without control (for instance to suffer incontinence or a facial tick) is to be the butt of cruel jokes, to be potentially embarrassed in public. It potentially reduces one’s independence. What was so clever about the language of the Leave campaign was that it spoke directly to this feeling of inadequacy and embarrassment, then promised to eradicate it. The promise had nothing to do with economics or policy, but everything to do with the psychological allure of autonomy and self-respect.

Consider the cover of the Daily Mail praising the decision and calling politicians “out-of-touch” and the EU “elite” and “contemptuous”:2

From this point of view, Davies thinks that the reward wasn’t the Leave, but the vote itself, a veritable middle finger to the UK center and the EU “eurocrats.” They know their lives won’t get better after a Brexit, but they don’t see their lives getting any better under any circumstances, so they’ll take the opportunity to pop a symbolic middle finger. That’s all they think they have.

And that’s where Davies thinks the victory  of the Leave vote parallels strongly with Donald Trump’s rise in the US:

Amongst people who have utterly given up on the future, political movements don’t need to promise any desirable and realistic change. If anything, they are more comforting and trustworthy if predicated on the notion that the future is beyond rescue, for that chimes more closely with people’s private experiences.

Some people believe that voting for Trump might in fact make things worse, but the pleasure of doing so — of popping a middle finger to the Republican party and political elites more generally — would be satisfaction enough. In this sense, they may be quite a lot like the Leavers. For the disenfranchised, a vote against pragmatism and solidarity may be the only satisfaction that this election, or others, is likely to get them.

Lisa Wade, PhD is an Associate Professor at Tulane University. She is the author of American Hookup, a book about college sexual culture; a textbook about gender; and a forthcoming introductory text: Terrible Magnificent Sociology. You can follow her on Twitter and Instagram.

Originally posted at Orgtheory.

6Iowa in 2008, Iowa in 2016

So there are a thousand reasons Trump won the election, right? There’s race, there’s class, there’s gender. There’s Clinton as a candidate, and Trump as a candidate, the changing media environment, the changing economic environment, and the nature of the primary fields. It’s not either-or, it’s all of the above.

But Josh Pacewicz’s new book, Partisans and Partners: The Politics of the Post-Keynesian Society, implies a really interesting explanation for the swing voters in the Rust Belt—the folks who went Obama in 2008, and maybe 2012, but Trump in 2016. These voters may make up a relatively small fraction of the total, but they were key to this election.

Pacewicz’s book, which just came out this month, doesn’t mention Trump, and presumably went to press long before Trump was even the presumptive Republican nominee. And the dynamics Pacewicz identifies didn’t predict a specific outcome. (In fact, Josh guest-blogged at orgtheory in August, but focused on explaining party polarization, and did not venture to predict a winner.)

But Partisans and Partners nevertheless does a really good job of explaining what just happened. Its argument is complex, and doesn’t imply a lot of obvious leverage points for decreasing political polarization or the desire for “disruptive” candidates. But I think it’s an important explanation nonetheless.

The book is based on ethnographic and interview data collected over a period of several years in two Rust-Belt Iowa cities of similar size, one traditionally Republican, and the other traditionally Democratic. Both of these cities saw a transformation in their politics in the 1980s. Until the 1970s, urban politics were organized around a partisan divide closely associated with local business elites, on the Republican side, and union leaders, on the Democratic side. Politics was highly oppositional, and the party that won local elections got to distribute a lot of spoils. But it was not polarized in the sense it is today—while there were fundamental differences between the parties, particularly on economic issues, positions on social issues were less rigidly defined.

During the 1980s, something changed. Pacewicz calls that something “neoliberal reforms”; I might argue that those are just one piece of a bigger economic transformation that was happening. But either way, the political environment shifted. Regulatory changes encouraged corporate mergers and buyouts. This put control of local industry in distant cities and hollowed out both business elites and union power. The federal government shifted from simply handing cities pots of money that the party in power could control, to requiring cities to compete for funds, putting together applications that would compete with those of other cities. This environmental change facilitated the decline of the old “partisans”—the business and labor elites—and the rise of a new group of local power brokers—the “partners”.

The partners were more technocratic and pragmatic. They did not have strong party allegiances, nor did they see politics as being fundamentally about competition between the incompatible interests of business and labor. Instead, they focused on building temporary alliances among diverse groups with often-conflicting interests. Think business-labor roundtables, public-private partnerships, and the like. This is what was needed to attract industry from other places (look how smooth our labor relations are!) and to compete for federal grants and incentives (cities with obviously oppositional politics tended to lose out). The end of politics. Sounds great, right?

The problem was that these dynamics also hollowed out local parties. The old partisans had lost power. Partners didn’t want to be active in party politics. This left parties to activists, who over time came to represent increasingly extreme positions—a new wave of partisans.

What did this mean for the average voter? Pacewicz shows how older voters still conceptualized the two parties as fundamentally reflecting a business/labor divide. But most younger voters came to understand politics as representing a divide between partners—people working together, setting aside differences, for the benefit of the community—and partisans—people representing the interests of particular groups.

Partners didn’t like politics. They didn’t really think it should exist. They disliked political polarization, thought that people were pretty similar underneath their surface differences, and that conflict was generally avoidable. They distrusted politics, their party affiliation tended to be provisional, and they often responded only to negative ads around hot-button issues.

The new partisans, on the other hand, were alienated from contemporary life. They thought things were going to hell in a handbasket. They were looking for change, and saw outsider candidates as appealing—candidates who promised to shake up the system. Many had a strong preference for Democrats or Republicans. But while for traditional voters party affiliation was rooted in a sense of positive commitment, for the new partisans, it was based on disaffection with the alternative. And a key group of “partisans” was politically uncommitted (a contradiction in terms?)—disaffected and angry and wanting politics to solve their problems, but not aligned with a party.

The 2008 election illustrates how these types respond to candidates. In the primaries, partners liked Obama, responding well to his post-partisan image. He was less favored by Democrats and traditional voters and partisans. By fall, though, traditional (Democratic) voters and (Democratic) partisans tended to get on board, while partners waffled as Obama came to seem more partisan.

The most erratic group was the uncommitted partisans. These people wanted somebody—anybody—to shake things up, to change the system. And they wanted somebody to represent them—the outsider. They tended to lean toward GOP candidates (one illustrative voter was a big Palin fan), but many also simply remained disaffected and stayed home.

This is the group, it seems to me, that is key to understanding the 2016 election. Democrats gonna Democrat, and Republicans gonna Republican. In the end, most people really aren’t swing voters. But the unaffiliated partisans are the type of voters who would have found some appeal in both Bernie and Trump: someone claiming to represent the everyman, and someone willing to shake up the status quo.

In the end, these folks are unlikely to be motivated to vote for a Clinton or a Romney. It’s just more of the same. But they can be energized by populism, and by the outsider. These are the people who will vote for Trump just as a big old middle finger to the system. Partisans and Partners isn’t specifically trying to explain Trump’s win, in Iowa or anywhere else. But it does as good a job as anything I’ve read at pointing in the direction we should be looking.

Elizabeth Popp Berman, PhD is an associate professor of sociology at the University at Albany, SUNY, and the author of the award-winning book Creating the Market University: How Academic Science Became an Economic Engine. 

No matter which way you voted or who wins, today will go down in history as the first time a woman either won or lost the presidency of the United States. Today, in a contemplative mood, I turned back to the chapter on politics I wrote with Myra Marx Ferree for our sociology of gender book. It’s an ode to the suffragist with a final paragraph that resonates very, very strongly on this day. Read, and let the reverberations of history stir your soul.

— Lisa

***

In 1848 a small group of American women made the decision to seek suffrage, the right to vote. For most of modern history, governments did not allow women this right, nor the other rights and responsibilities of citizenship—to serve on juries, give legal testimony, or hold public office—and American women were no exception. Many thought the idea was impossible, dangerous, even laughable. Opponents mocked suffragists, suggesting that giving women the vote was as ridiculous as giving it to housecats.

4

The fight for suffrage was not won quickly or easily and many suffragists died of old age before they could see their efforts realized. In addition to ridicule, suffragists faced government repression and violence. Most suffragists were peaceful, but some weren’t above aggression themselves. One group in the United Kingdom set buildings on fire and learned jujitsu to defend themselves from the police. Over 1,000 suffragists would be imprisoned in the United Kingdom and United States. There they endured brutal force-feeding after initiating hunger strikes that endangered their lives.

The fight for suffrage involved both inspiring coalitions and ugly divides. Many suffragists were abolitionists first, activists in the fight against human slavery. White and black men and women worked side-by-side for this hard-won victory. After slavery was abolished in 1865 and black men were granted suffrage in 1869, black women continued to fight valiantly for their own vote. As abolitionist Sojourner Truth observed: “If colored men get their rights, and colored women not theirs, the colored men will be masters over the women, and it will be just as bad as it was before.”

White suffragists often disagreed on whether their efforts should benefit all women or only white women. Anti-suffrage activists tapped into widespread animosity toward black people, reminding a racist public that women’s suffrage would not only put women into the voting booth, it would double the black vote. Some suffragist groups were themselves racist, excluding black women from their organizations, activities, or platform. Many black women started suffrage organizations of their own.

Eventually, suffragists began making alliances with women in other countries. By the early 1900s, this international women’s organizing had begun to shift public opinion in their favor. Finland and New Zealand were the first to grant women the right to vote in the 1910s. The United States came around in 1920, giving suffrage to both black and white women together. By then the movement was rolling across the globe. In less than thirty years, women’s suffrage became a global norm. The last state to disallow women’s voting, Saudi Arabia, allowed them to vote in 2015.

Today universal suffrage, the right of all citizens to vote, is the very definition of democracy. This right is taken for granted today, so much so that many people don’t even know the word anymore. In the 1800s, however, it was a wholly radical claim, defined as an idea that doesn’t (yet) resonate with most members of a population. In fact, it was a massively important step toward dismantling political systems that recognized some people as full citizens but not others. It was also extraordinarily disruptive to the social order and the distribution of power. It is a testament to the fact that, even when social conditions are stubbornly entrenched and defended by powerful people, change—even radical change—is possible.

Lisa Wade, PhD is a professor at Occidental College. She is the author of American Hookup, a book about college sexual culture, and a textbook about gender. You can follow her on Twitter, Facebook, and Instagram.

Myra Marx Ferree, PhD is a professor at the University of Wisconsin, Madison. She is the recipient of numerous prizes for contributions to gender studies and does research on global gender politics. Among her many books is a textbook on the sociology of gender , with Lisa Wade.

According to a report from the Brennan Center for Justice, tens and sometimes hundreds of thousands of votes are rejected or miscast because of known bad ballot designs. Intuitive design is especially important because approximately 50 million people each year encounter a ballot design for the first time, either because they’ve moved, are new to voting, or because the ballot has been revised. People who are most vulnerable to ballot design disenfranchisement are people living in poverty, older voters, and new voters.

Some problems with ballot designs:

  • Including all instructions at the beginning of the ballot instead of alongside each task.
  • Passive voice; negatives.
  • Small or unreadable fonts, like this:

6

  • Unnecessarily complex language.
  • Listing candidates for a single office on multiple pages.
  • Including more than one contest per page.
  • Centered, all-caps, and dense text, like this:

3

  • Inconsistent use of font or failure to differentiate different kinds of information with shading or font.
  • Confusing indications as to how to indicate the voter’s choice.
  • Publicizing sample ballots that don’t match actual ballots.

There are many examples of good and bad ballots at the Brennan Center’s report, Better Ballots.

The Brennan Center asserts that these problems are easily identified. Unfortunately, many jurisdictions aren’t paying attention: very few pre-test their ballot designs to discover problems and few examine results of election to discover which counties’ elections are most undermined by lost and miscast votes. Some jurisdictions, moreover, are operating under laws that require the use of ballot designs that we know are bad and many are using voting machines that are not flexible enough to accommodate good design.

Good ballot design, the report emphasizes, is non-partisan, well understood, inexpensive, and simple to implement. It may not be the most scandalous way to lose hundreds of thousands of votes, but it’s a real and substantial problem, and one that can be easily fixed.

Lisa Wade, PhD is an Associate Professor at Tulane University. She is the author of American Hookup, a book about college sexual culture; a textbook about gender; and a forthcoming introductory text: Terrible Magnificent Sociology. You can follow her on Twitter and Instagram.

Originally posted at Montclair SocioBlog.

Is Donald Trump undermining the legitimacy of the office of the presidency? He has been at it a while. His “birther” campaign – begun in 2008 and still alive – was aimed specifically at the legitimacy of the Obama presidency. Most recently, he has been questioning the legitimacy of the upcoming presidential election and by implications all presidential elections.

If he is successful, if the US will soon face a crisis of legitimacy, that’s a serious problem. Legitimacy requires the consent of the governed. We agree that the government has the right to levy taxes, punish criminals, enforce contracts, regulate all sorts of activities…  The list is potentially endless.

Legitimacy is to the government what authority is to the police officer – the agreement of those being policed that the officer has the right to enforce the law. So when the cop says, “Move to the other side of the street,” we move. Without that agreement, without the authority of the badge, the cop has only the power of the gun. Similarly, a government that does not have legitimacy must rule by sheer power. Such governments, even if they are democratically elected, use the power of the state to lock up their political opponents, to harass or imprison journalists, and generally to ensure the compliance.

Trump is obviously not alone in his views about legitimacy.  When I see the posters and websites claiming that Obama is a “tyrant” – one who rules by power rather than by legitimate authority; when I see the Trump supporters chanting “Lock Her Up,” I wonder whether it’s all just good political fun and hyperbole or whether the legitimacy of the US government is really at risk.

This morning, I saw this headline at the Washington Post:

1

Scary. But the content of the story tells a story that is completely the opposite. The first sentence of the story quotes the Post’s own editorial, which says that Trump, with his claims of rigged elections, “poses an unprecedented threat to the peaceful transition of power.” The second sentence evaluates this threat.

Trump’s October antics may be unprecedented, but his wild allegations about the integrity of the elections might not be having much effect on voter attitudes.

Here’s the key evidence. Surveys of voters in 2012 and 2016 show no increase in fears of a rigged election. In fact, on the whole people in 2016 were more confident that their vote would be fairly counted.

2

The graph on the left shows that even among Republicans, the percent who were “very confident” that their vote would be counted was about the same in 2016 as in 2012. (Technically, one point lower, a difference well within the margin of error.)

However, two findings from the research suggest a qualification to the idea that legitimacy has not been threatened. First, only 45% of the voters are “very confident” that their votes will be counted. That’s less than half. The Post does not say what percent were “somewhat confident” (or whatever the other choices were), and surely these would have pushed the confident tally well above 50%.

Second, fears about rigged elections conform to the “elsewhere effect” – the perception that things may be OK where I am, but in the nation at large, things are bad and getting worse. Perceptions of Congressional representatives, race relations, and marriage follow this pattern (see this post). The graph on the left shows that 45% were very confident that their own vote would be counted. In the graph on the right, only 28% were very confident that votes nationwide would get a similarly fair treatment.

These numbers do not seem like a strong vote of confidence (or a strong confidence in voting). Perhaps the best we can say is that if there is any change in the last four years, it is in the direction of legitimacy.

Jay Livingston is the chair of the Sociology Department at Montclair State University. You can follow him at Montclair SocioBlog or on Twitter.